Manufactured
Capital

Intellectual
Capital
Key enablers
- Leverage economies of scale
- Improve speed-to-market
- Reduce our environmental impact
Risks identified
- Changing consumer
preferences - Hyperinflation and
currency devaluation
- Commodity
price volatility - Regulatory


We are streamlining our product line and reassessing our innovation methods to concentrate on core priorities. Our strategy involves using our production capabilities to emphasize high-profit items and optimize inventory. Additionally, we are enhancing operational efficiency through sustainable manufacturing practices, Industry 4.0 technologies, and rigorous quality management.

33%
Reduction in
India SKUs

Zero
Waste to landfill
since 2019

130 Km
Distance reduced
to transport
Finished Goods
over last 2 years

Plastic
neutral
In India

Net
zero
by 2035 for
Scope 1 and 2
emissions
Streamlining product offerings and
enhancing process efficiencies
We have centered our operations on innovation from the start. Our approach to product innovation and enhancement has been redefined, focusing on high-impact opportunities that generate significant long-term value for our stakeholders. Our refined innovation strategy prioritizes the introduction of fewer but more impactful New Product Developments (NPDs) capable of driving substantial growth.
To drive our innovation capabilities, We have embraced key principles:
- A ‘Less is more’ principle: Prioritizing fewer, larger, and superior innovations.
- Enhanced consumer-centricity: Utilizing deep insights, with a focus on consumer input in decision-making.
- 100% Objectivity: Employing a rigorous stage-gate process with proper governance.
- Global integration: Efficiently harnessing synergies for global impact.
- Sustainability integration: Ensuring sustainability is ingrained in our products from inception.
While new brand development remains pivotal for value creation, we plan to phase out smaller brands where it aligns with our broader value realization strategy.
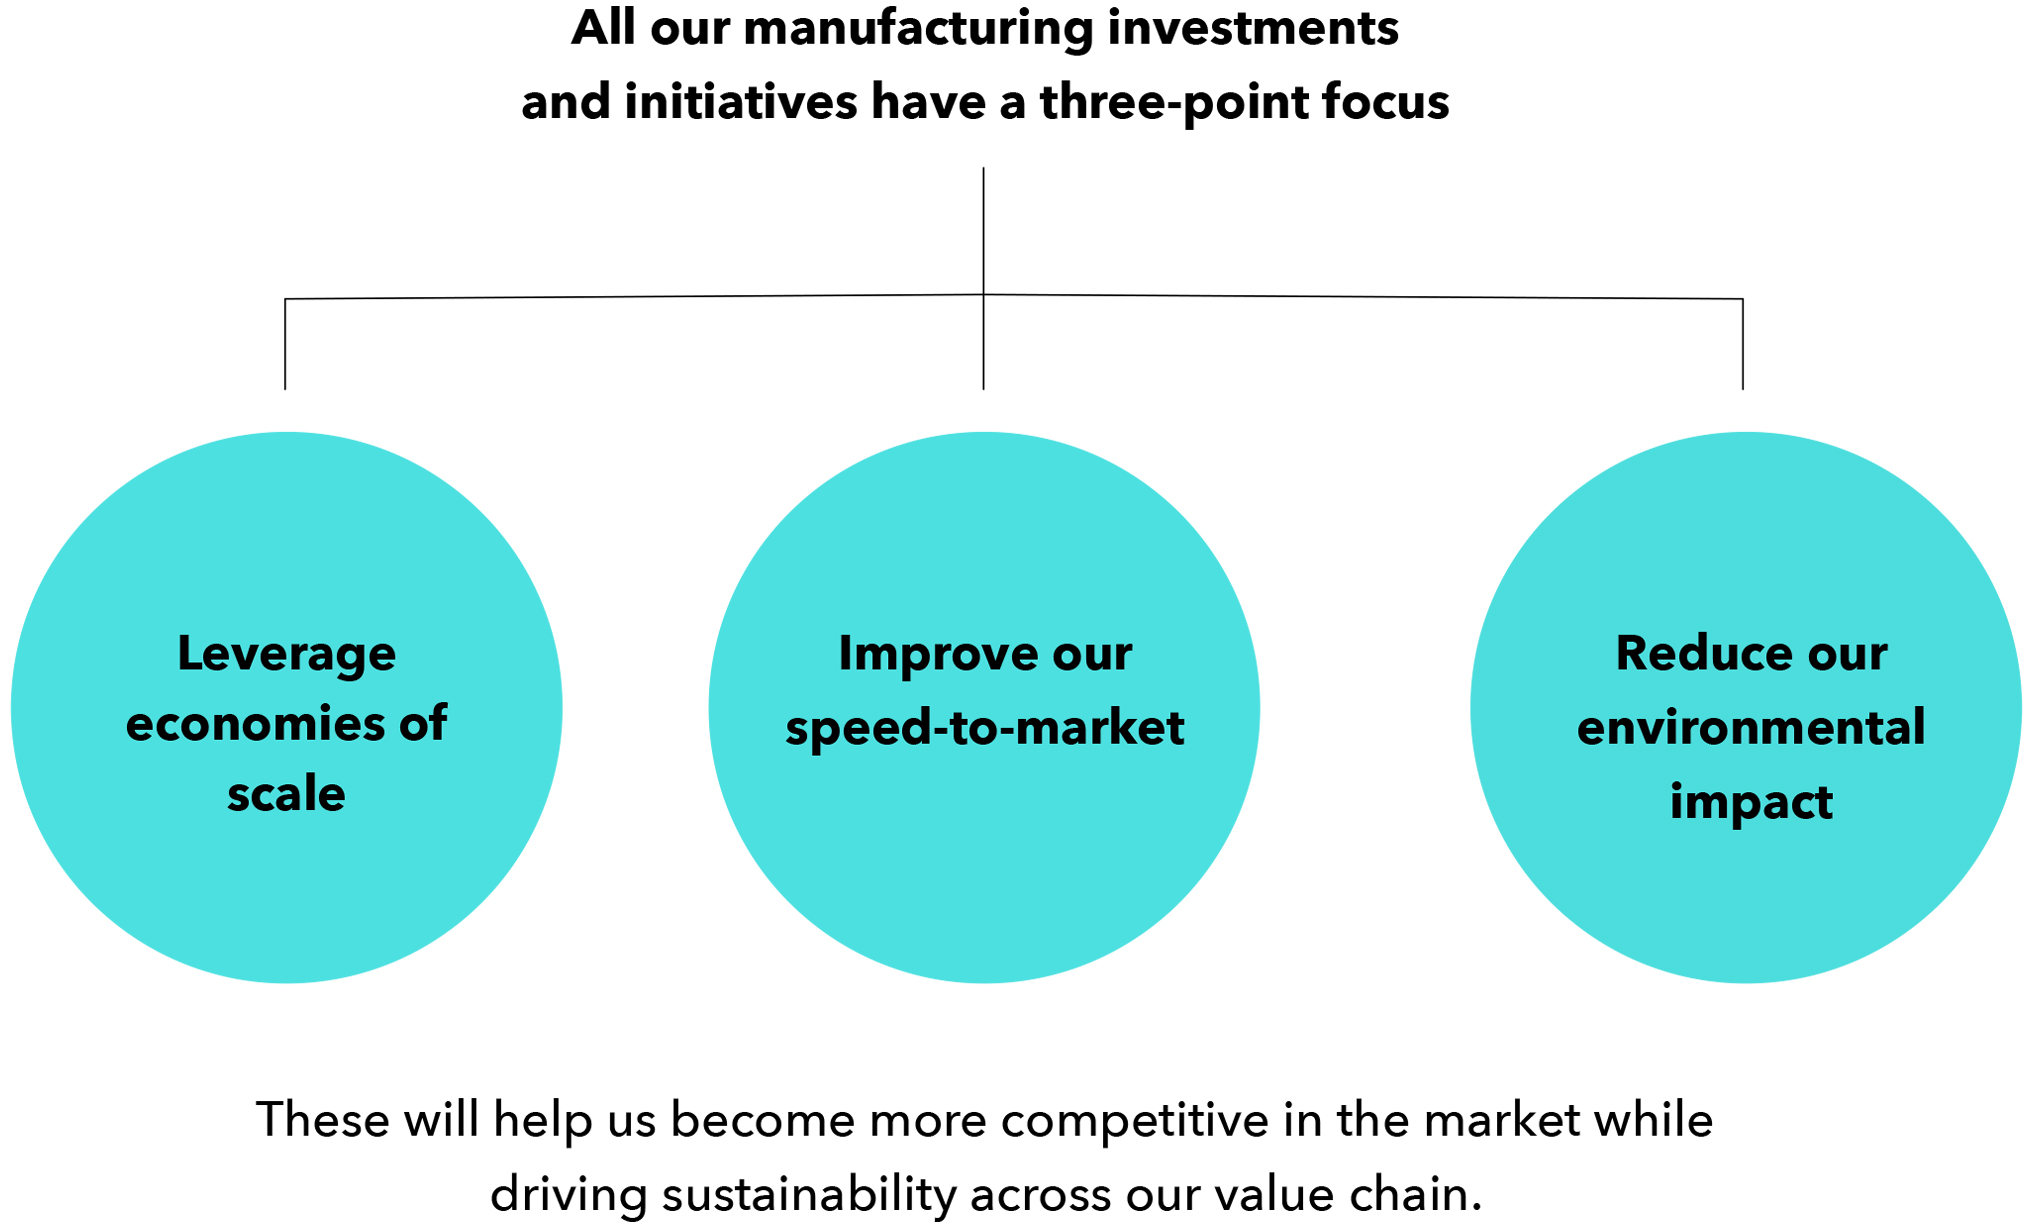
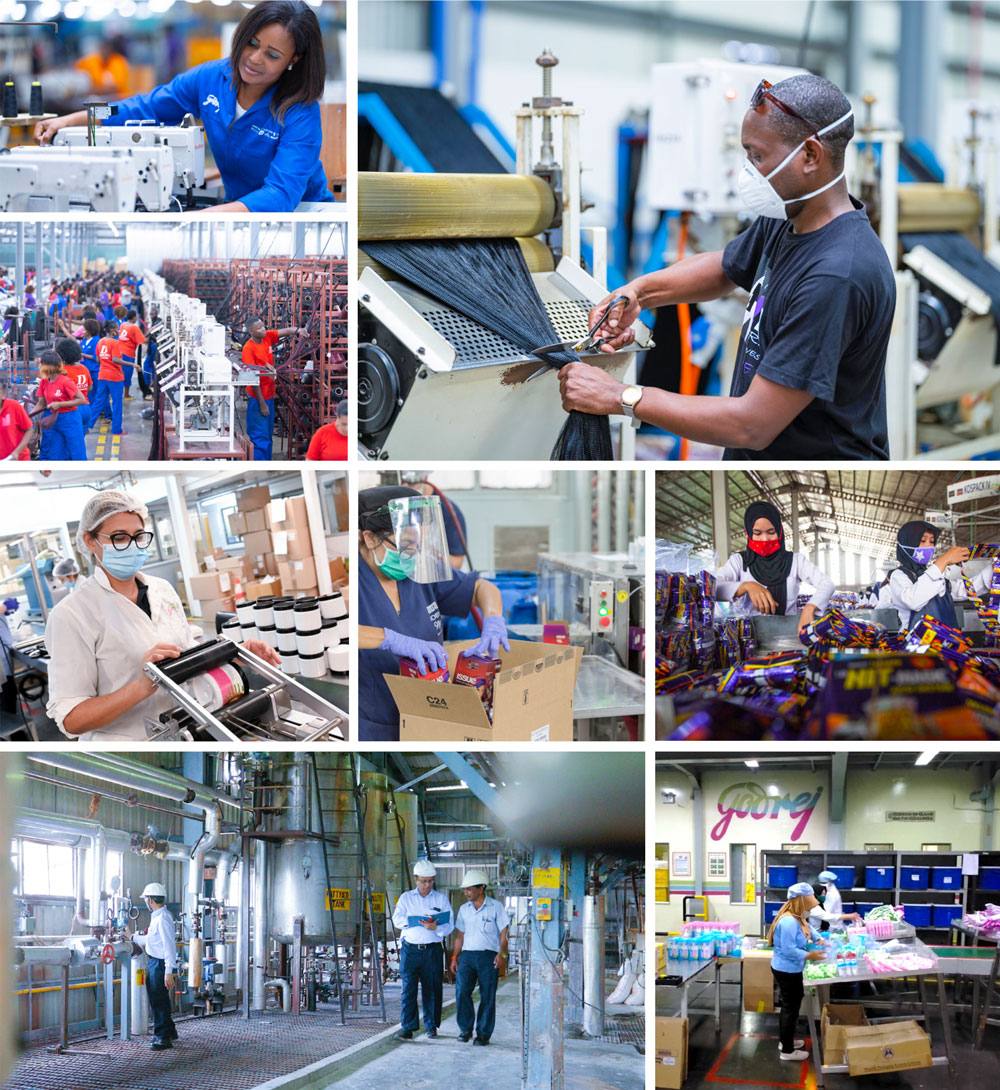
Factories across our locations in India, Africa,
Latin America, and Indonesia
Critical enablers
1. SKU rationalisation
We have prioritized resource optimization and operational efficiency through a Stock Keeping Unit (SKU) rationalization strategy across our product lines, focusing particularly on high-performing products. This approach has streamlined our portfolio, resulting in notable improvements in manufacturing efficiency and waste reduction.
In March 2023, we had 1414 SKUs in Africa, comprising 1140 SKUs in hair fashion (a 36% rationalization) and 274 SKUs in wet hair products (a 10% rationalization). By February 2024, we reduced the SKUs to 1229, with 999 SKUs in hair fashion and 230 SKUs in wet hair products, achieving a 12% optimization in hair fashion and a 16% optimization in wet hair products for fiscal year 2024. This reduction reflects a 13% decrease in SKUs for the fiscal year, driven by our SKU rationalization efforts.
Our optimization initiatives resulted in reducing overall inventory levels from 93 days to 67 days. SKU rationalization has aligned our inventory more closely with actual demand, making our supply chain more efficient by reducing excess inventory and lowering the risk of overstocking and associated costs. We have also improved the accuracy of demand forecasts and refined planning processes to better predict customer demand.
Overall, in the GAUM regions (Africa, Middle East, and US), we improved our SKU rationalization significantly by 33% in fiscal year 2023 compared to fiscal year 2022. This improvement resulted in a decrease in SKUs produced from 4,910 in fiscal year 2022 to 3,280 in fiscal year 2023.
In Indonesia, our Product Range Simplification initiative is an ongoing effort that commenced last year, resulting in a 50% reduction in our product portfolio. The initiatives deployed during fiscal year 2023 have yielded significant benefits in fiscal year 2024. These include a further reduction of 10 days in inventory turnover, ensuring zero generation of new slow-moving and obsolete stock during the current year, and achieving tighter control over the entire supply chain. This streamlined approach has enhanced our operational efficiency and strengthened our inventory management practices, contributing to a more agile and responsive supply chain system.
2. Inventory optimisation
In our ongoing quest for operational excellence, we have achieved a significant milestone by reducing our inventory days. This strategic improvement in working capital management enhances our ability to respond to market fluctuations and align our supply chain more effectively with consumer demand. To achieve this, we have implemented various digital initiatives throughout our manufacturing and supply chain processes. One such initiative is the adoption of a Transportation Management System, which has improved our transportation operations, optimized routes and loads, and reduced freight costs.
Additionally, we have streamlined scheduling and planning procedures through automation, creating a seamless supply chain that enables immediate decision-making and enhances overall efficiency. Significant advancements have been achieved in critical initiatives, including the establishment of a future network layout for our distribution system and the adoption of sales strategies driven by replenishment for our distributors.
Concurrently, we are continually enhancing our demand forecasting capabilities using advanced analytics and historical sales data. This approach enables us to forecast future demand more accurately, adjust inventory levels proactively, and minimize the risk of stock-outs or excess inventory.
Our commitment to optimizing inventory remains unwavering as we explore and implement innovative solutions to drive efficiency, cut costs, and elevate customer satisfaction globally.
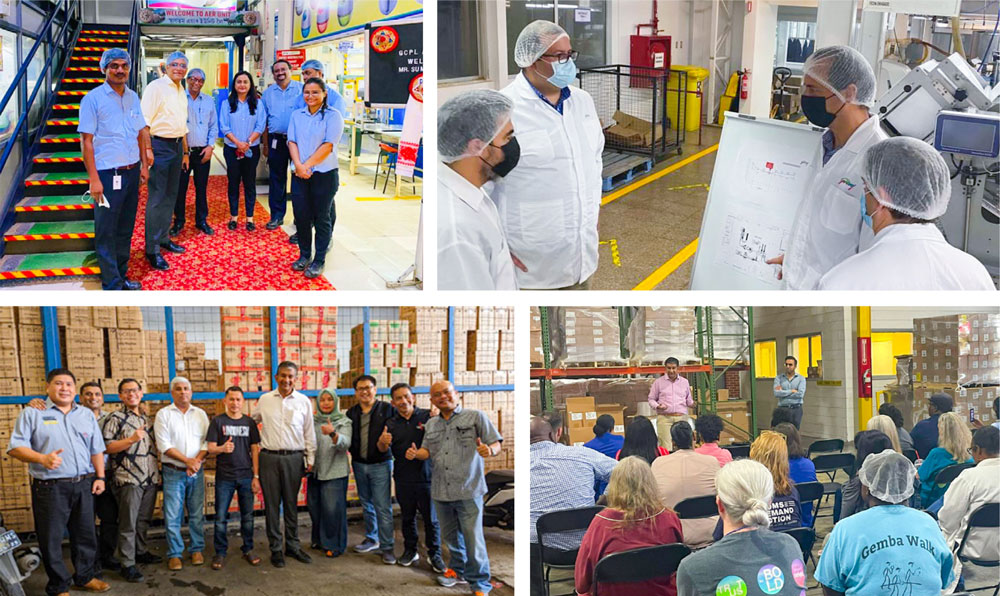
Engaging with shopfloor employees
3. Industry 4.0
We have made strategic investments in advanced automation technologies and IT systems to optimize our manufacturing processes, minimize manual intervention, and enhance operational efficiency.
In our North Cluster, we have installed an Energy and Utility Management System (EMS/UMS) at our Kathua plant. This system facilitates the daily monitoring and analysis of plant and utility energy consumption data, helping us to identify energy-saving opportunities and undertake timely corrective actions. Since the deployment of the EMS, specific energy consumption has been reduced by a commendable 35%, demonstrating the effectiveness of our initiatives. Real-time tracking and analysis of energy consumption data enable us to make informed decisions, ensuring optimal equipment performance and energy efficiency.
Additionally, at both the Katha and Kathua plants, we have executed several utility projects aimed at further enhancing energy efficiency. Our investments in automation have led to significant improvements in productivity and resource utilization. The installation of robotic pelletizers, advanced die sets, and productivity dashboards has streamlined our manufacturing processes, resulting in notable manpower savings and improved productivity by 10%. Moreover, our focus on continuous improvement extends to quality management, with the implementation of real-time quality inspection dashboards and standardized work procedures.
Our Industry 4.0 digitization initiatives have not only boosted productivity but also led to lower energy expenses. These initiatives are in line with our environmental goals while extending the lifespan of our equipment.
In the South Cluster, our focus on operational excellence and sustainability is evident through the deployment of advanced technologies and initiatives aimed at enhancing efficiency and reducing environmental impact. To enhance production monitoring and performance, we have integrated online IoT sensors into the Refill Line at our South Cluster. These sensors provide real-time data on production count, runtime, downtime, quality loss, and overall performance, enabling proactive decision-making and process optimization.
To streamline attendance management, we have installed Attendance Face Reader systems across all locations. This innovative technology enables employees to punch their attendance conveniently, regardless of their base location, while integration with our payment portal is underway to further enhance efficiency.
Our commitment to automation extends to various areas, including production lines and material handling processes. We have installed an Auto Hanger Feeding system, resulting in a reduction of 9 manpower/day. Similarly, the introduction of Auto Cartoning and Auto Coil Pick & Place machines in the Coil Packing process has led to significant manpower savings of 18/day. Moreover, the deployment of an Automatic Finished Goods Loading Conveyor has streamlined operation.
In the Northeast Cluster, we have made significant strides in automation by installing an Auto Leaflet Feeder. This implementation has led to manpower savings of 3 individuals per day, streamlining our operations and enhancing efficiency. At Lokhra 2 unit, we have implemented Ezee 20 gm online flow wrapping technology, coupled with a traffic management system, optimizing manpower by 12 individuals per day, reflecting our commitment to continuous improvement. Additionally, we have successfully converted the Omori 200 UPM LLP flow wrap machine for Fast card flow wrapping at the Lokhra 2 unit, incorporating a new booklet and leaflet feeder. This modification has resulted in a reduction of 9 manpower requirements per day, further enhancing operational efficiency. We have installed an online flow wrap machine with a leaflet feeder at Coil-8, leading to manpower savings of 12 individuals per day. Moreover, we have invested in infrastructure enhancement by installing a new 2.5-ton Hydraulic lift at our NC-53 unit, enabling us to utilize the 3rd floor as a raw material and packaging material store. This strategic move has facilitated the release of one external godown, contributing to operational streamlining and cost efficiency.
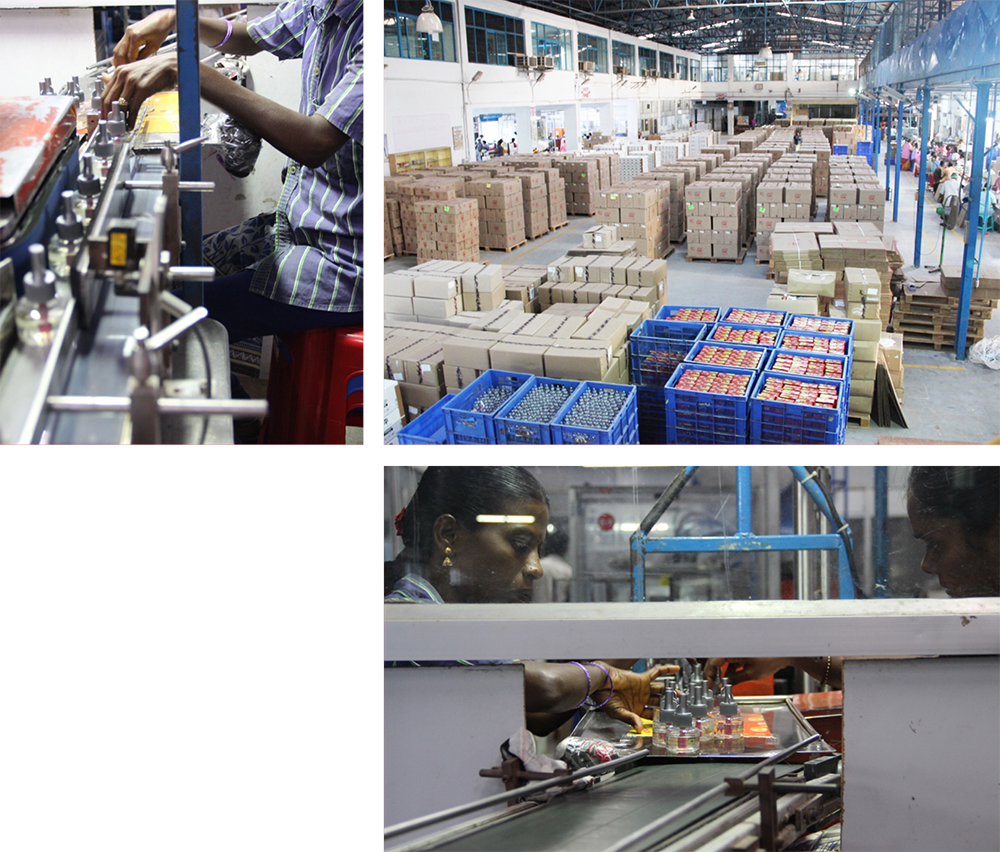
IoT implementation at our
manufacturing facilities
In the Central West Cluster, our Malanpur plant now operates an Energy and Utility Management System (EMS/UMS), enabling daily monitoring and analysis of plant and utility energy consumption (electrical and steam) against daily targets. This system offers insights for immediate corrective actions to reduce energy consumption, resulting in a notable 7% reduction in specific energy consumption since implementation. Real-time tracking and analysis of energy usage guide our decisions, optimizing equipment performance and energy efficiency.
Additionally, IoT integration in RO1 & RO2 for tank heating has saved steam, with plans for effective steam trap monitoring, blowdown management, and digitalization of boiler flue gases. Digital displays across Soap lines 1 to 5 provide real-time production data, machine speeds, wrapping machine performance, and quality defect videos for safety awareness. The ongoing implementation of IoT for Overall Plant Efficiency (OPE) calculation in line 5 promises online monitoring of Availability, Performance, and Quality loss, enhancing line efficiency. To ensure consistent soap noodle output from CSP3, we have added standby SCADA, augmenting Mazzoni’s single provision.
In Indonesia, our integration of IoT technology has significantly enhanced data capture from our manufacturing lines, particularly in HIT aerosol and wipes production. This data plays a crucial role in setting precise baselines, identifying system-wide losses, and implementing corrective actions for mitigation. As a direct outcome, we have reduced spares and maintenance costs by 8% for fiscal year 2024. Furthermore, this initiative has improved machine efficiency, resulting in increased capacity and subsequent Capex savings due to process enhancements.
In our manufacturing operations, we have deployed SMART coil feeding systems across Coil-6, Coil-7, and Coil-9 units to reduce manpower needs. Additionally, an IoT-based flow-wrapping system with smart feeding has been integrated into Line-2 of Coil-9 to lessen reliance on manual labour. At our Conso facility, an IoT-linked servo capper has been installed in the refill line, addressing quality issues caused by broken wicks.
In the Northeast cluster, we have initiated 27 automation projects, including flow wrap, cartoning, and filling machines, resulting in reduced manpower requirements and enhanced Overall Equipment Effectiveness (OEE). Notably, OEE for Godrej Expert Rich Crème and aer lines has increased by 13% and 7.6%, respectively.
Within the Central West cluster, we have executed 8 automation projects, including flow wrap machines, soap banding machines, and electric stackers, leading to reduced manpower needs and substantial cost savings.
4. Sustainable manufacturing
Our commitment to sustainability extends to optimizing manufacturing processes, reducing waste, and adopting energy-efficient technologies. These efforts aim to minimize our environmental impact and support a sustainable future. We are implementing sustainability initiatives throughout our supply chain and extending them to vendors via our Sustainable Procurement Policy.
Aligned with our Good & Green vision, we have set environmental sustainability goals for 2025-26. These include making one-third of our products greener than those in 2020, sourcing at least 35% of our energy from renewables, and maintaining zero waste to landfill status. We are also aiming to double our energy productivity by 2030 as per our EP100 commitment.
We monitor energy, emissions, water, and renewable data across locations under our full operational control. Incorporating carbon and water pricing helps us assess the financial impacts of our activities, guiding sustainability decisions throughout the value chain.
To track progress against our environmental goals, we follow the ‘IPCC Guidelines for National Greenhouse Gas Inventories, 2006’ and the ‘IPCC AR6 Assessment Report’. Our sustainability team at the corporate level oversees performance, supported by manufacturing cluster heads and team members at each site.
For further information, please refer to our
Sustainable Procurement Policy

Our processes include:
- Conducting extensive meetings with various stakeholders to align priorities, budgets, and anticipated benefits for the fiscal year.
- Establishing targets aimed at enhancing environmental sustainability across our manufacturing processes and product lines.
- Incorporating sustainability goals into the core responsibilities of designated ‘Green Champions’ within our annual operational plan.
- Utilizing an internal sustainability tracking tool for data collection and analysis, producing monthly reports that focus on key metrics, including carbon emissions following the GHG protocol.
- Sharing and promoting best practices through multiple channels for broader adoption.
- Implementing a robust governance framework to monitor, assess, and enhance sustainability performance.
- Strategically planning improvements for underperforming units.
- Establishing an innovation unit to explore advanced sustainability solutions for the medium to long term.
- Participating in various ESG disclosures to benchmark our performance against industry peers, engaging external consultants as needed for specialized initiatives like materiality assessments or climate risk evaluations.
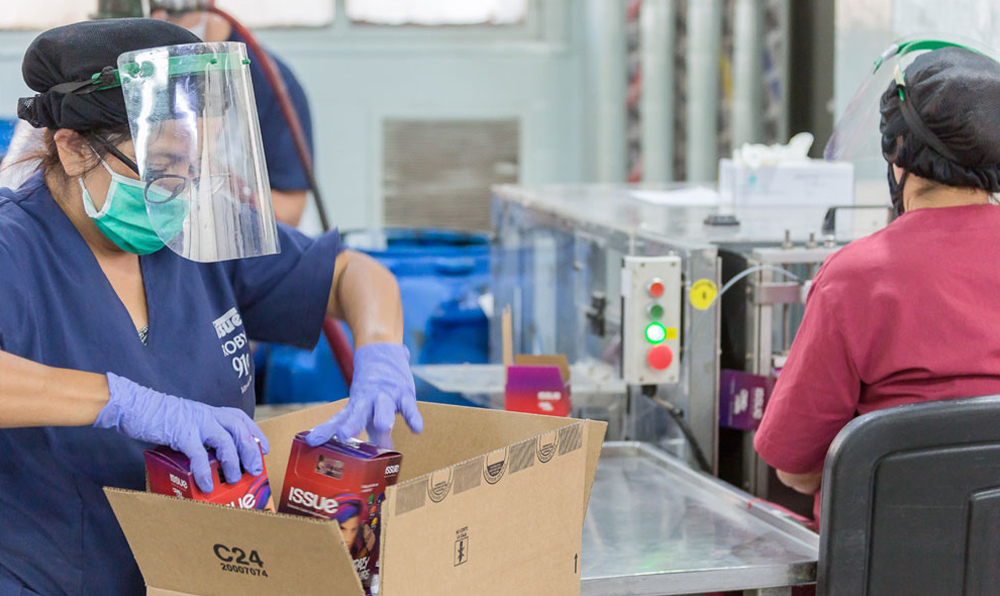
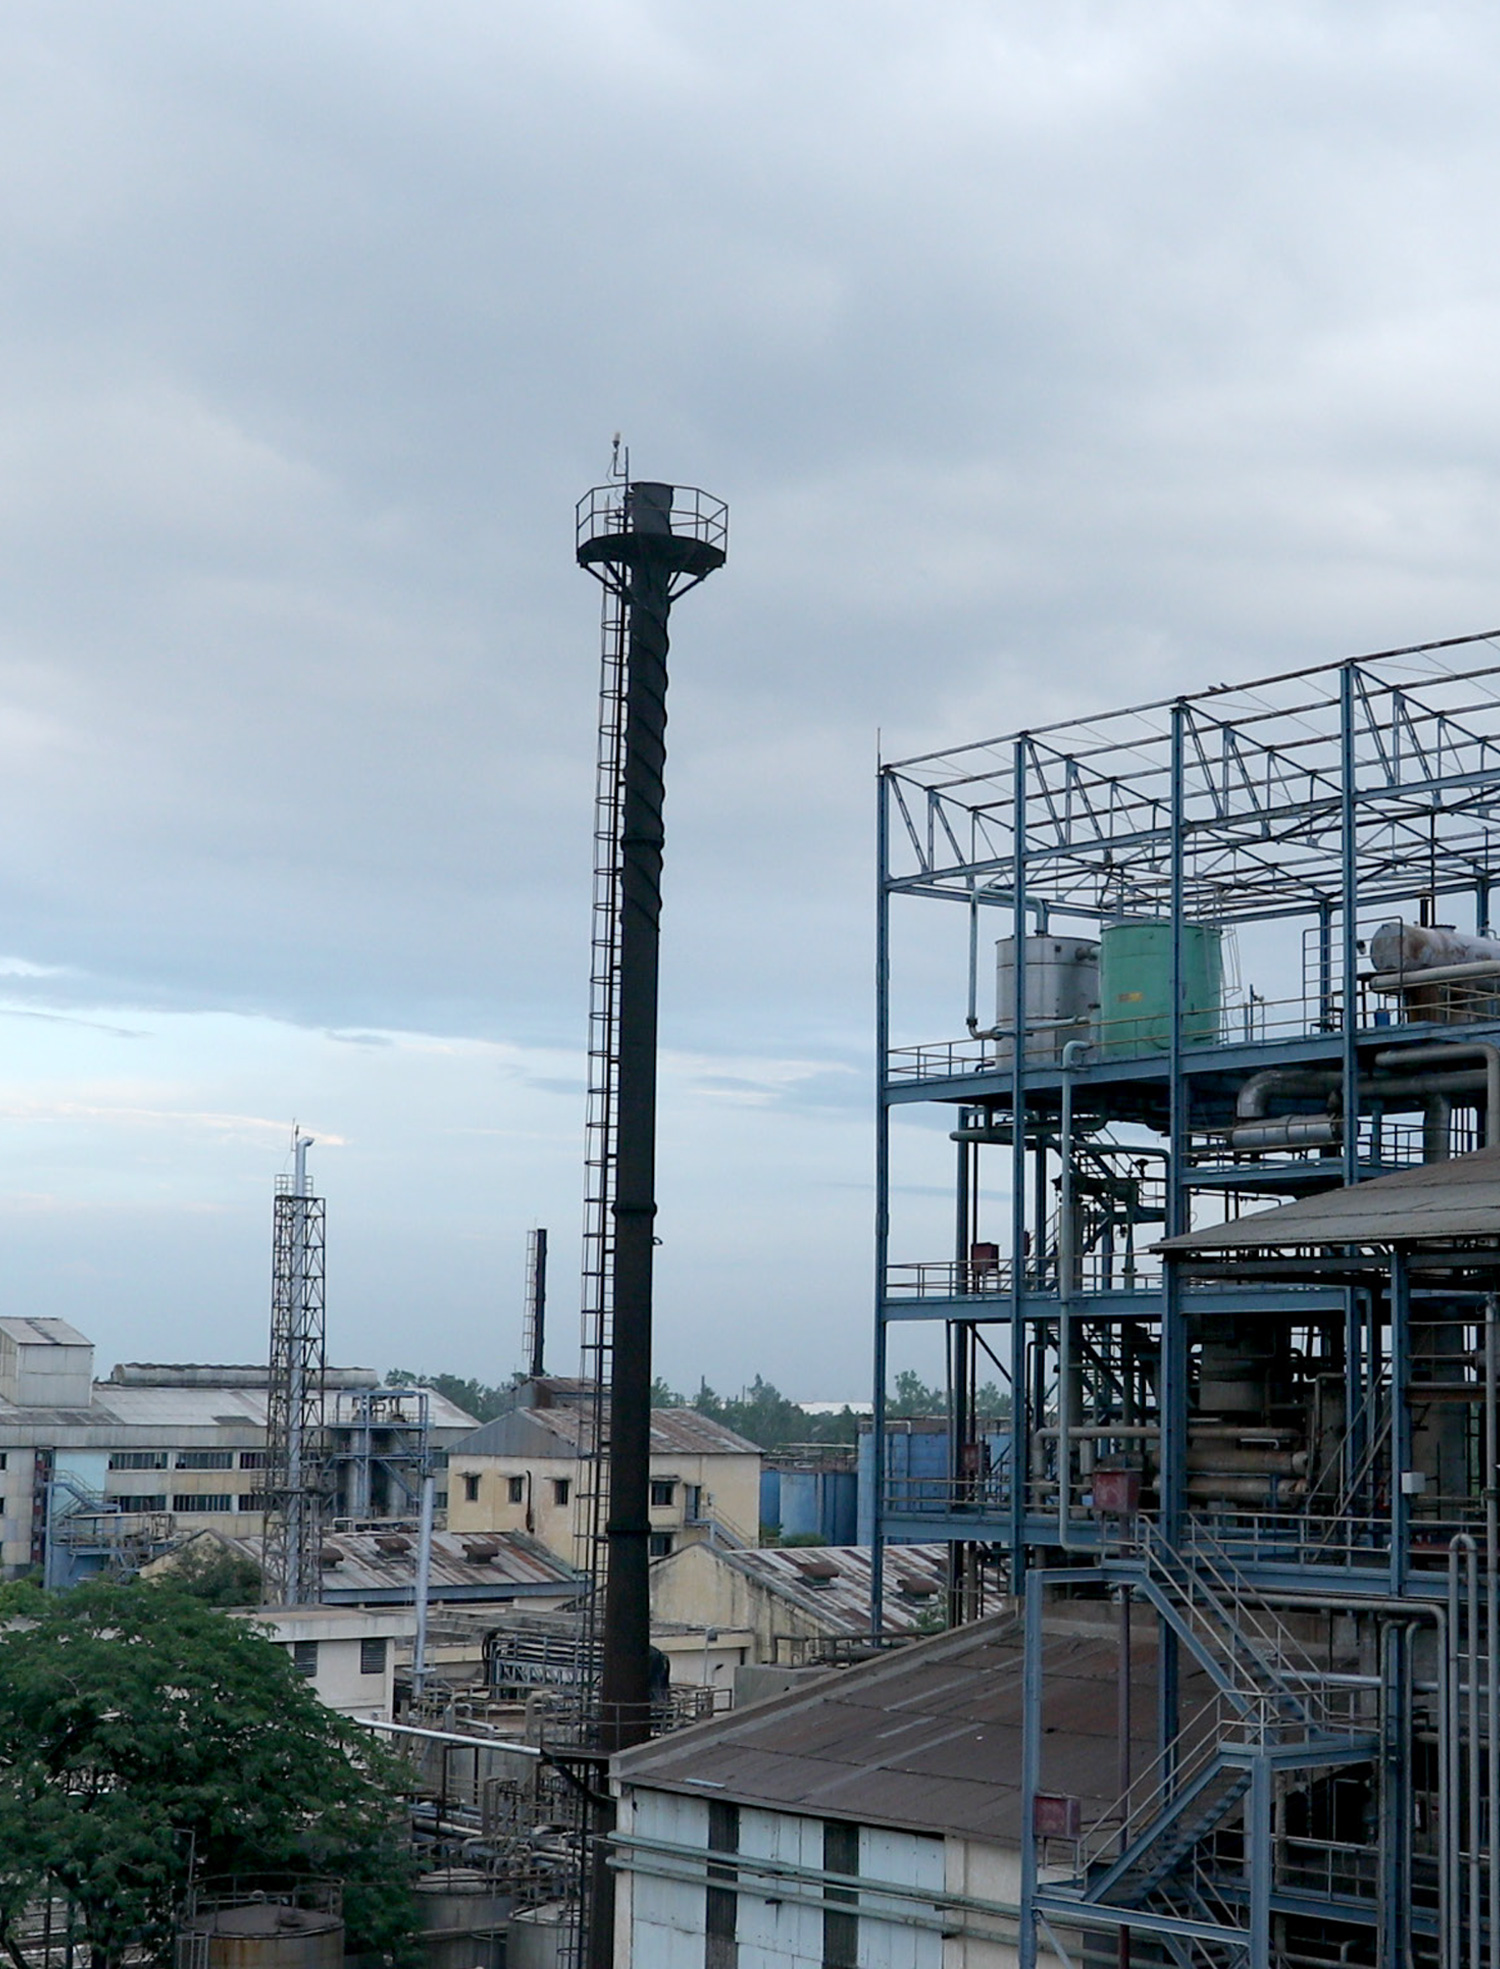
Enhancing our manufacturing processes to
support a more sustainable future
Our goals and progress
01
Energy*


Reduce specific energy consumption by 40% by 2025 (v. 2011 baseline)
Increase renewable energy portfolio to 35% by 2025 (v. 2011 baseline)
Our Approach
- Process enhancements leading to enhanced system efficiency.
- Integration of renewable energy sources like solar and biomass
- Technology advancements and upgrades

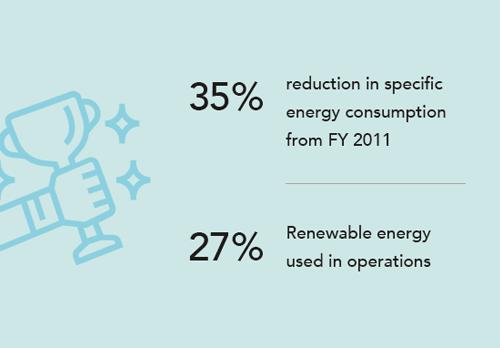
Reduced our specific energy consumption
by 35%
Increased renewable energy portfolio
to 27%
02
Water**


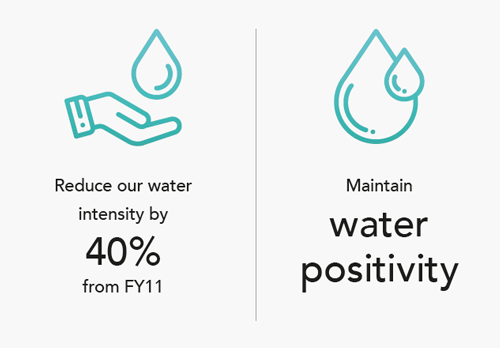
Reduce water intensity by 40% by 2025 (v. 2011 baseline) while maintaining water positivity
Our Approach
- Revolutionary water management systems, advancements in technology, and the comprehensive integrated watershed management initiative.

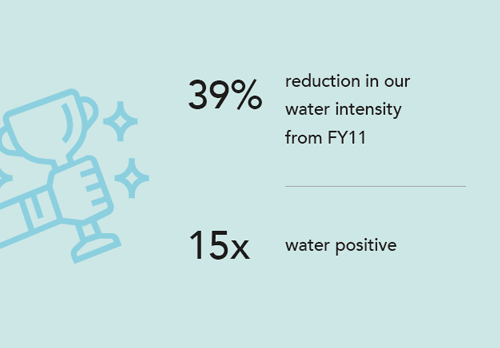
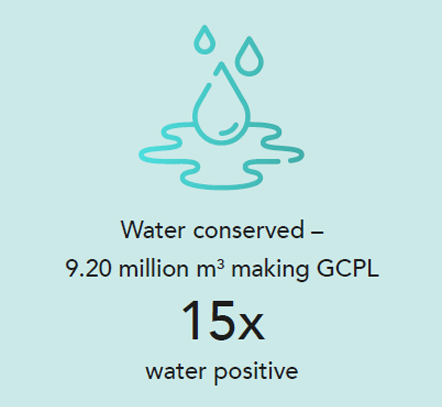
Reduced water intensity by 39% and achieved 15x water positivity (through rainwater harvesting within our facilities and our community watershed programme, we are conserving 15 times more water than we use in our operations).
03
Emissions***


Reduce GHG emission intensity by 45% by 2025 (v. 2011 baseline)
Our Approach
- Integrating sustainable energy sources like biomass and ongoing enhancements in operational efficiencies.

Reduced our GHG emission intensity by 41%
04
Waste


Sustainable packaging commitment
- Maintain zero waste to landfill and achieve zero liquid discharge
- Collect and recycle 100% of pre- and post-consumer plastic
- Minimum 50-microns thickness of plastic product labelling to include the thickness of plastic and extended producer responsibility (EPR) registration details
- 20% reduction in packaging intensity
- 80% of plastic used to be recyclable
- Rigid plastics to be replaced by 30% recycled plastic by the fiscal year 2025-26. Flexible plastics to be replaced by 10% recycled plastic by the fiscal year 2026-27 and multi-layer plastics to be replaced by 5% recycled plastic by the fiscal year 2026-27.
Our Approach
- Strategically leveraging materials through innovative practices such as reuse and recycling, promoting greater circularity.
- Implementing a robust monitoring framework to oversee and execute initiatives aimed at reducing plastic packaging consumption and intensity.
- Engaging with vendors and businesses to enhance our utilization of PCR plastic in place of virgin plastic, contributing to sustainability goals and environmental stewardship.

Our waste to landfill has reduced by 100% (diverted 100% waste from landfill)
We are plastic neutral in India and collect and recycle 100% of pre- and post-consumer plastic that we send out
*Energy use is calculated by specific energy consumption per tonne of production.
**Water usage is calculated by specific water consumption per tonne of production.
***Emissions are tracked for Scope 1 and 2 and calculated by specific GHG emissions per tonne of production.
Note: For India operations
1. Energy
2023 was warmest the year on record since 1850 serving as a stark reminder of the escalating climate crisis. In the face of this daunting reality there are challenges, but also opportunities to innovate, and to build a more resilient and sustainable world in which businesses like ours, have a crucial role to play. Moreover, fossil fuels are finite resources, their prices can be volatile. For us, energy efficiency and renewable are at the heart of our operations. By using less energy, we are able to lower our costs and by switching to renewables sources of energy we are able to get long-term cost savings and reduce operational expenses.
We follow a comprehensive approach that includes upgrading to more efficient equipment, switching to renewable technologies, and implementing energy-efficient practices across all our manufacturing sites.
The 2025 targets are taken up by each of our manufacturing sites. Every plant head’s annual operating plan has targets to reduce energy consumption, increase renewable energy use and ensure savings and lower emissions.
Our approach includes emphasising process enhancements to improve energy efficiency and adopting renewable energy sources such as solar and biomass among others. We carry out periodic energy audits to help us identify areas where energy is wasted or inefficiently used. We analyse our processes, equipment, and systems, to uncover opportunities for improvement. Energy audits also highlight equipment maintenance needs that ensure they are serviced regularly and operate more efficiently, preventing unexpected breakdowns and production delays.
By 2025, we aim to –
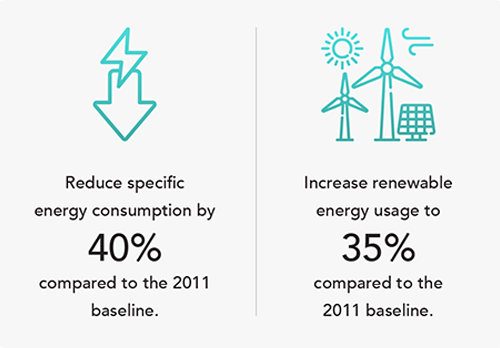
As of FY24, we have achieved –
Our energy initiatives include –
- In our Central West manufacturing cluster, we approached setting up our new soap plant with energy efficient systems in design. We installed an energy efficient CSP in the new soap expansion plant. This resulted in savings of Rs.200 lakhs. We have also installed energy efficient vacuum pumps, heat exchangers and IOT-based systems in RO to reduce our energy consumption.
- Most of our lighting motion-sensor based and we have switched to LED and solar lights. We have also switched to energy-efficient BLDC Fans in our South cluster plants to reduce our energy use.
- To reduce energy consumption, we have introduced innovative technologies like Fluid Bed Dryers (FBD) and Three-phase power factor controllers in our Northeast and South clusters respectively, leading to significant energy savings.
- Through energy audits we identified and addressed multiple leakage points in our compressed air systems in the Northeast cluster. We invested in replacing the default valves and pipes and plug the leakages.
- Several of our manufacturing sites have installed rooftop and shed solar panels that add to our renewable energy portfolio. We also use renewable biomass briquettes in our boilers instead of furnace oil.
Twice a year, we organise a green manufacturing conference where our green champions from various manufacturing sites gather to learn and share best environmental practices. During these conferences, we increase awareness about energy efficiency programmes and offer training on latest technology solutions for energy efficiency, conservation and renewables. We also bring in industry experts to share their insights and advancements, enhancing our team’s knowledge and skills in sustainable practices.
Sustainability goals are a part of the manufacturing head’s annual KPIs. The Green Manufacturing Governing Council is led by the Managing Director of Godrej Industries Group and GCPL’s board-level ESG Committee reviews the environmental progress on a quarterly basis. Our sustainability monitoring tool records the performance of individual manufacturing units and analyses the data on a periodic basis. The portal accounts for key parameters such as production, materials, water and energy consumed, and waste generated, both hazardous and non-hazardous. The tool also calculates the respective carbon footprint as per the set GHG protocols. We devise a strategic action plan for underperforming units post discussion with the plant head to improve sustainability performance.
Impact initiative
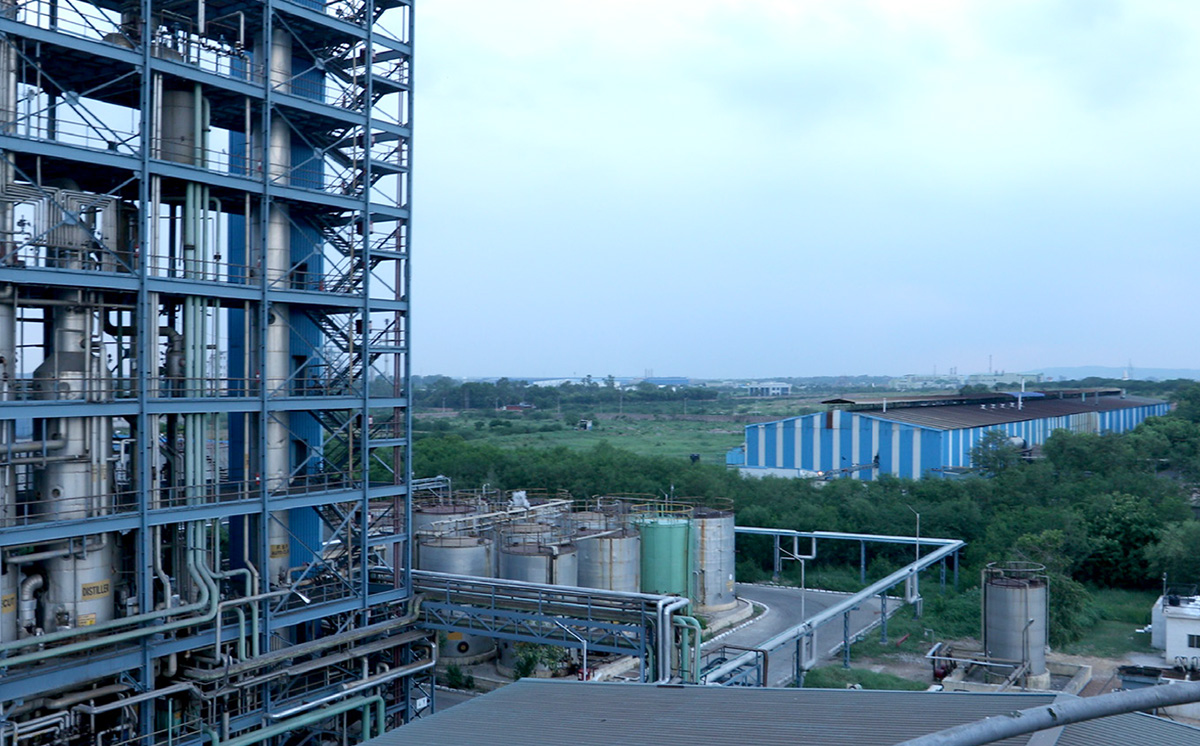
Biomass briquettes in boilers
We have shifted from using fossil fuels to using clean energy sources in our manufacturing. Biomass briquettes are derived from organic materials like agricultural waste, wood chips, or sawdust. Unlike finite fossil fuels such as furnace oil, biomass is renewable and abundant. They have a far lower carbon footprint and lower impact on air quality. Moreover, they are locally available and cost-efficient. Most of our boilers now use biomass briquettes as fuel and this has helped increase our renewable energy portfolio.
We are compliant with all the relevant environmental laws and regulations in the regions in which we operate. We ensure to follow all the rules of the land. Our energy intensity is 2,111 MJ/MT of product. Majority of our manufacturing facilities are ISO 14001 and ISO 9001 compliant.
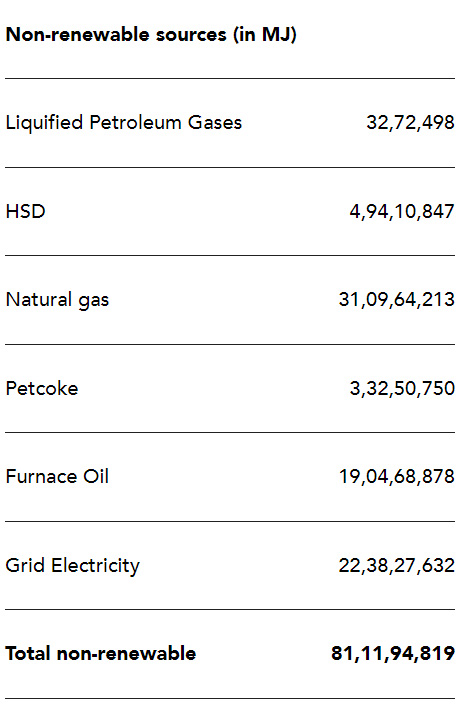
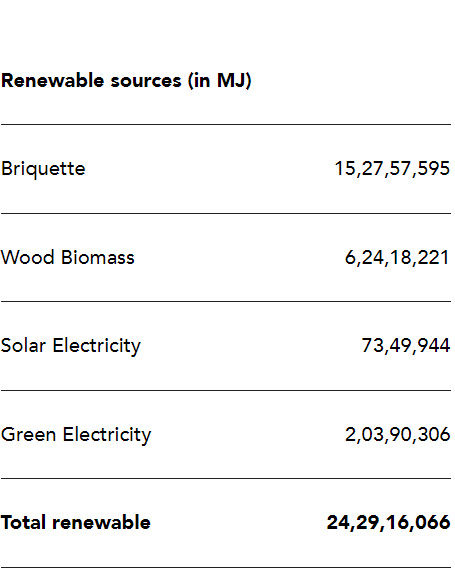
Our energy consumption
Global energy consumption (in MWh)

Global energy consumption - 1,05,41,10,885 MJ
2. Water
About half of the world’s population experiences severe water scarcity for at least part of the year. Rainfall extremes have been increasing worldwide, as have the frequency, duration and intensity of droughts. Climate change is projected to intensify the global water cycle, and to further increase the frequency and severity of droughts and floods. In emerging economies where we operate, poor water quality is mainly due to low levels of wastewater treatment. In the face of this daunting reality there are opportunities to innovate and to build resilience.
At GCPL, we focus on reducing our water footprint and impact across all our manufacturing operations, in the products we make, and in the communities we operate.
We have focussed on reducing our water use across our value chain. Each of our manufacturing sites have annual environmental targets that includes reducing water use. We are also focussing on safeguarding water resources in drought-prone regions and water stress areas where we operate.
We carry out water use assessment to quantify water use in our manufacturing process, in our products, and of the regions where we operate. We organise regular water audits to measure our water use in manufacturing and identify hotspot areas for optimising water use. Through detailed life-cycle assessments we map water footprint from raw material sourcing to end-of-use for our products. We have also carried out a Task Force on Climaterelated Financial Disclosures (TCFD) assessment and examined key parameters such as temperature, water scarcity, and precipitation, all of which will have a crucial role in shaping the impact of climate change on our business.
Our water management initiatives at manufacturing include –
- Across all our manufacturing plants in India, we have adopted a zeroliquid discharge process. Through comprehensive wastewater treatment and water recycling processes such as tertiary reverse osmosis to improve wastewater quality, we ensure that all water used in our manufacturing process is recycled and repurposed.
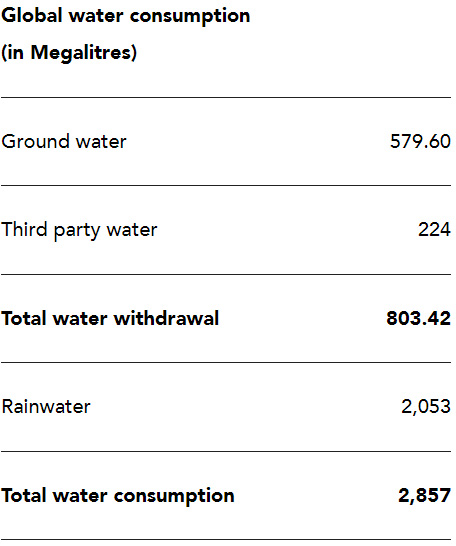
- We have invested in a number of rainwater harvesting structures in South, North, and Central West clusters that helps us harvest over 20,53,390 KL of water/annum and reduce our freshwater withdrawal.
- To reduce water consumption, we installed 365 eco taps in our North East cluster that helps us save 626 KL of water/annum.
- We have identified and eliminated leakages from fire hydrant lines on our North cluster. With 4 other water conservation projects North cluster has achieved saving of 6,900 KL of water/annum.
- We have implemented sensor-based water taps in South cluster to further reduce our water use.
By 2025, we aim to –
As of FY2024, we have achieved –
Twice a year we organise green manufacturing conference where all our green champions from across manufacturing sites gather for learning and sharing best environmental practices. As part of the learning, we create awareness on water efficiency programmes and bring in industry experts to share state-of-the-art technology solutions for water efficiency, treatment, and recycling.
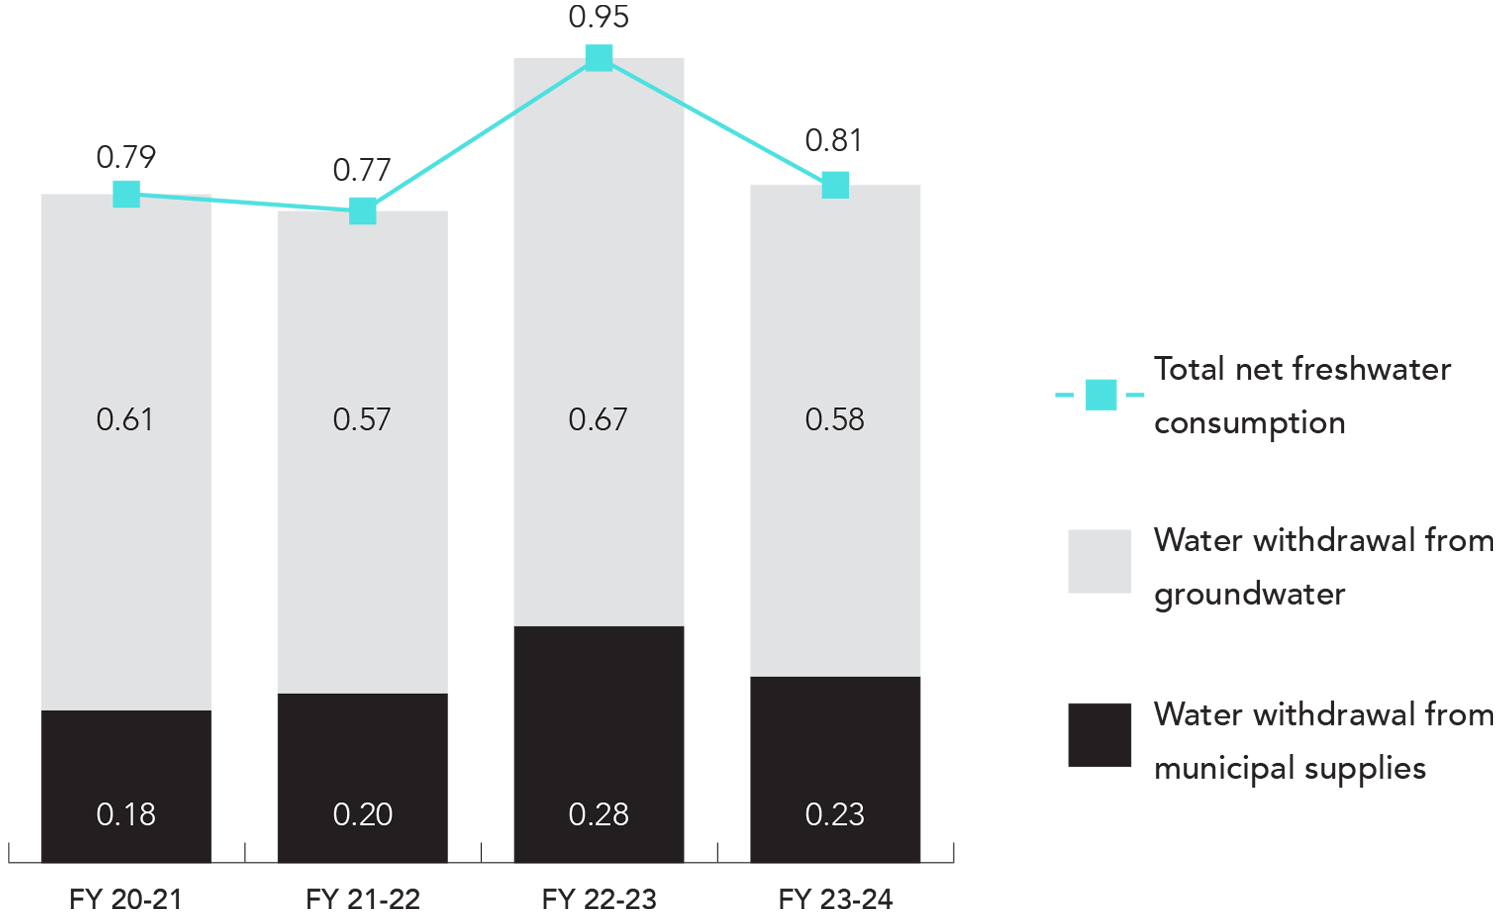
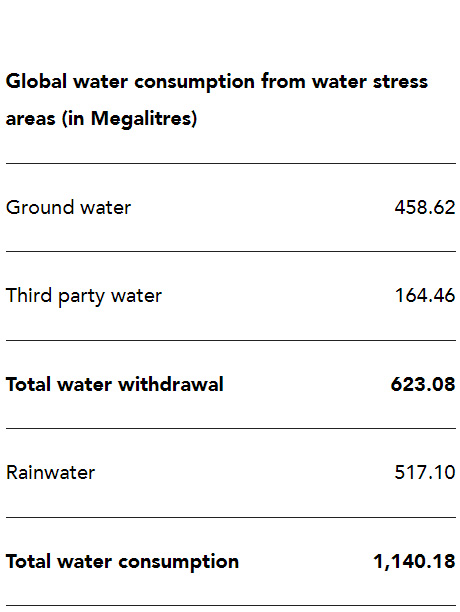
Global water withdrawal (in million cubic meters)
Impact initiative
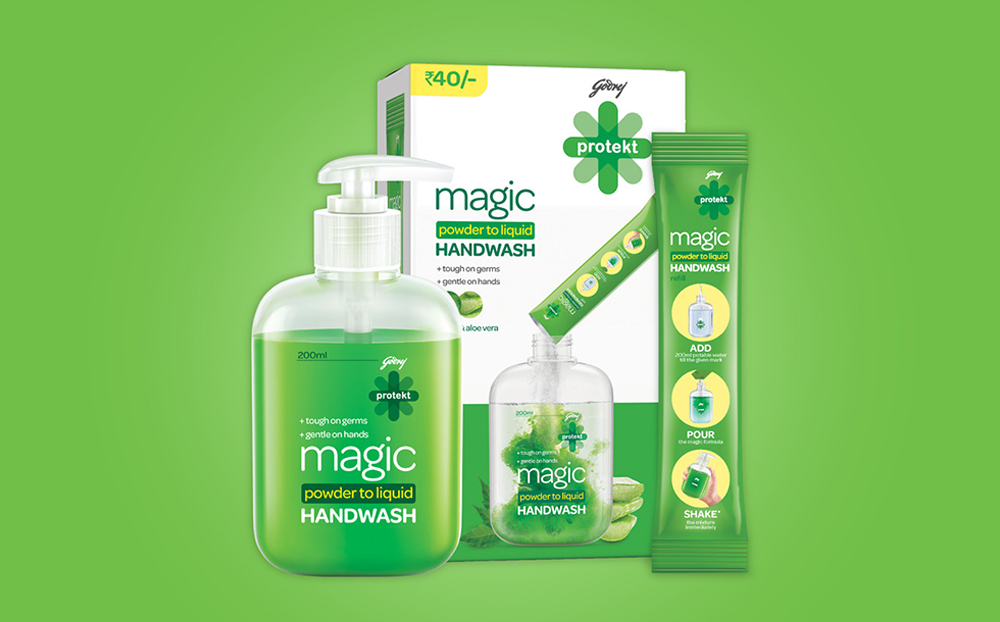
Our Godrej magic range of personal care products is reconstituted formulation that reduces water, plastic and transportation costs. Due to high water content of personal care products, tonnes of water is shipped before production and makes the finished product heavier while it is transported. Our magic handwash is powder to liquid handwash that uses half the plastic to package than regular handwash refill, along with significant water, fuel and paper savings.
Integrated community watershed management
Our integrated watershed development project is dedicated to restoring the ecological balance in the drought-prone district of Siddipet in Telangana. Currently, groundwater levels in many areas are below 400 feet, placing significant pressure on farmers. To address this, we have joined forces with NABARD and a local NGO to rejuvenate the land, replenish groundwater levels, facilitate essential irrigation, prolong cropping cycles, enhance both the quality and quantity of produce, improve livelihoods, and promote sustainable agricultural practices.
We have successfully treated 2,950 hectares of land, covering the total project area. To date, we have distributed over 8.5 lakh saplings for direct planting and seed dibbling. Additionally, the project
has established 39 pandals and installed 25 drip irrigation systems on farmers’ lands, with a 30% contribution from the beneficiary farmers. We have also trained over 100 farmers in alternative agricultural practices.
3. Emissions
Extreme weather events due to climate change is one of the top global risks both in the short and the long-term. The effects of climate change are non-linear and exponential causing devastating impacts on countries in vulnerable regions. We are committed to be a part of the solution. We understand the magnitude of the task at hand and are unwavering in our dedication to reduce our emissions. Our commitment is rooted in actions that are guided by our comprehensive climate change mitigation strategy, clear targets, and regular assessments of our progress and impacts.
We monitor greenhouse gas (GHG) emissions, set short-term reduction targets, aim for long-term net-zero Scope 1 and 2 emissions, and reduction of Scope 3 emissions through supplier engagement in line Paris Agreement’s goal of limiting average global warming to 1.5 degrees Celsius. We have also instituted a robust energy efficiency program with specific targets for energy reduction. Our aim is to double our energy productivity by 2030 compared to the 2018 baseline, aligning with the Climate Group’s EP100 initiative. We also strive to reduce our air emissions from our manufacturing processes.
Here’s how we are greening our operations and lowering our emissions -
- We are increasing our renewable energy portfolio by switching to biomass briquettes instead of furnace oil or diesel for majority of boilers. We have invested in captive solar at our premises and are also purchasing green power from third party PPAs and open access systems. We have also invested in a cogeneration plant at our largest manufacturing site in Malanpur which will significantly boost our renewable energy consumption.
- We have investing in energy efficiency improvements by replacing old motors with energy efficient ones, installing variable frequency devices to optimise our energy and make process modifications to improve productive and reduce energy consumption. Installation of solar lights, LED lights, and motion sensor systems further help reduce our energy consumption.
- Our transport management system plays a crucial role in our overall emission impact. We are optimising our logistics and transportation to reduce our carbon footprint. This includes optimizing delivery routes to reduce mileage, and even exploring alternative, greener modes of transport and fuel-efficient vehicles. We work closely with our partners to ensure they align with our environmental standards. We have invested in a transport management system to improve route planning, vehicle loading, and delivery scheduling, further optimising travel and emissions.
We are advocates of the goals of the Paris Agreement and are aligned with limiting average global warming to 1.5 degrees Celsius.
Emission reduction targets

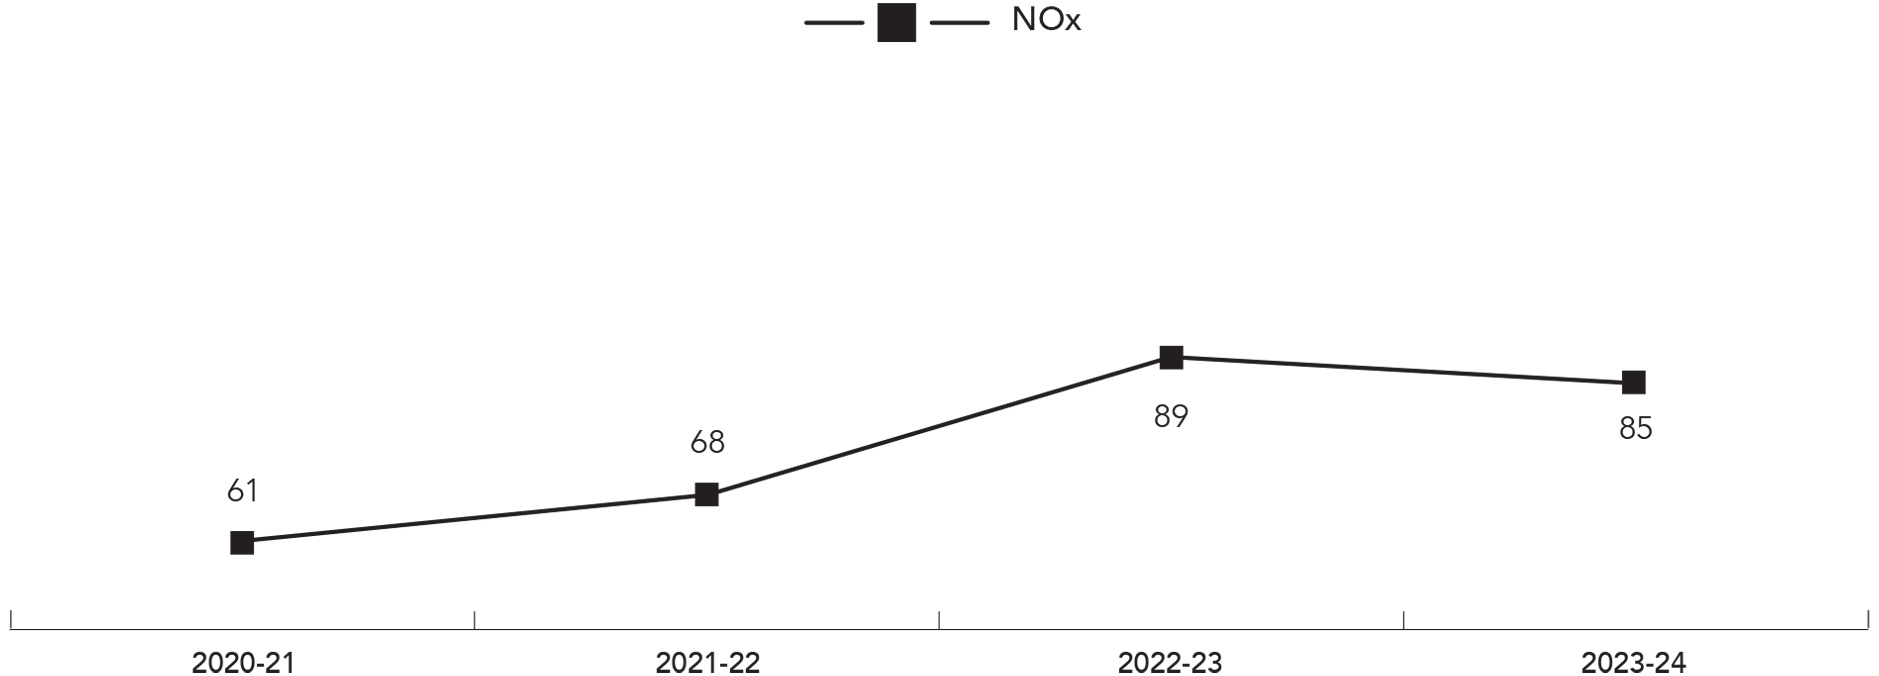
NOx emissions - India (MT NOx equivalent)
Global Scope 1 and 2 emissions (tCO2 equivalent)
Note: The calculation for the FY22-23 & FY23-24 in tCO2e and previous years is in tCO2
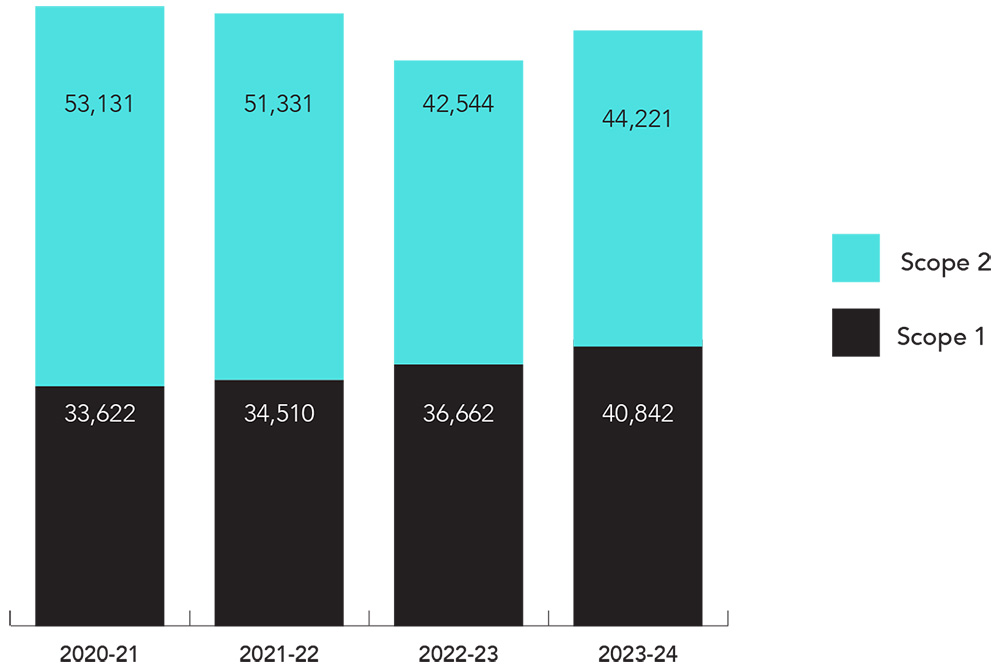
For FY23-24, our Scope 1 energy intensity is 0.082 tCO2e/MT of product, our Scope 2 energy intensity is 0.089 tCO2e/MT of product.
Our scope 1 and 2 net-zero roadmap till 2035
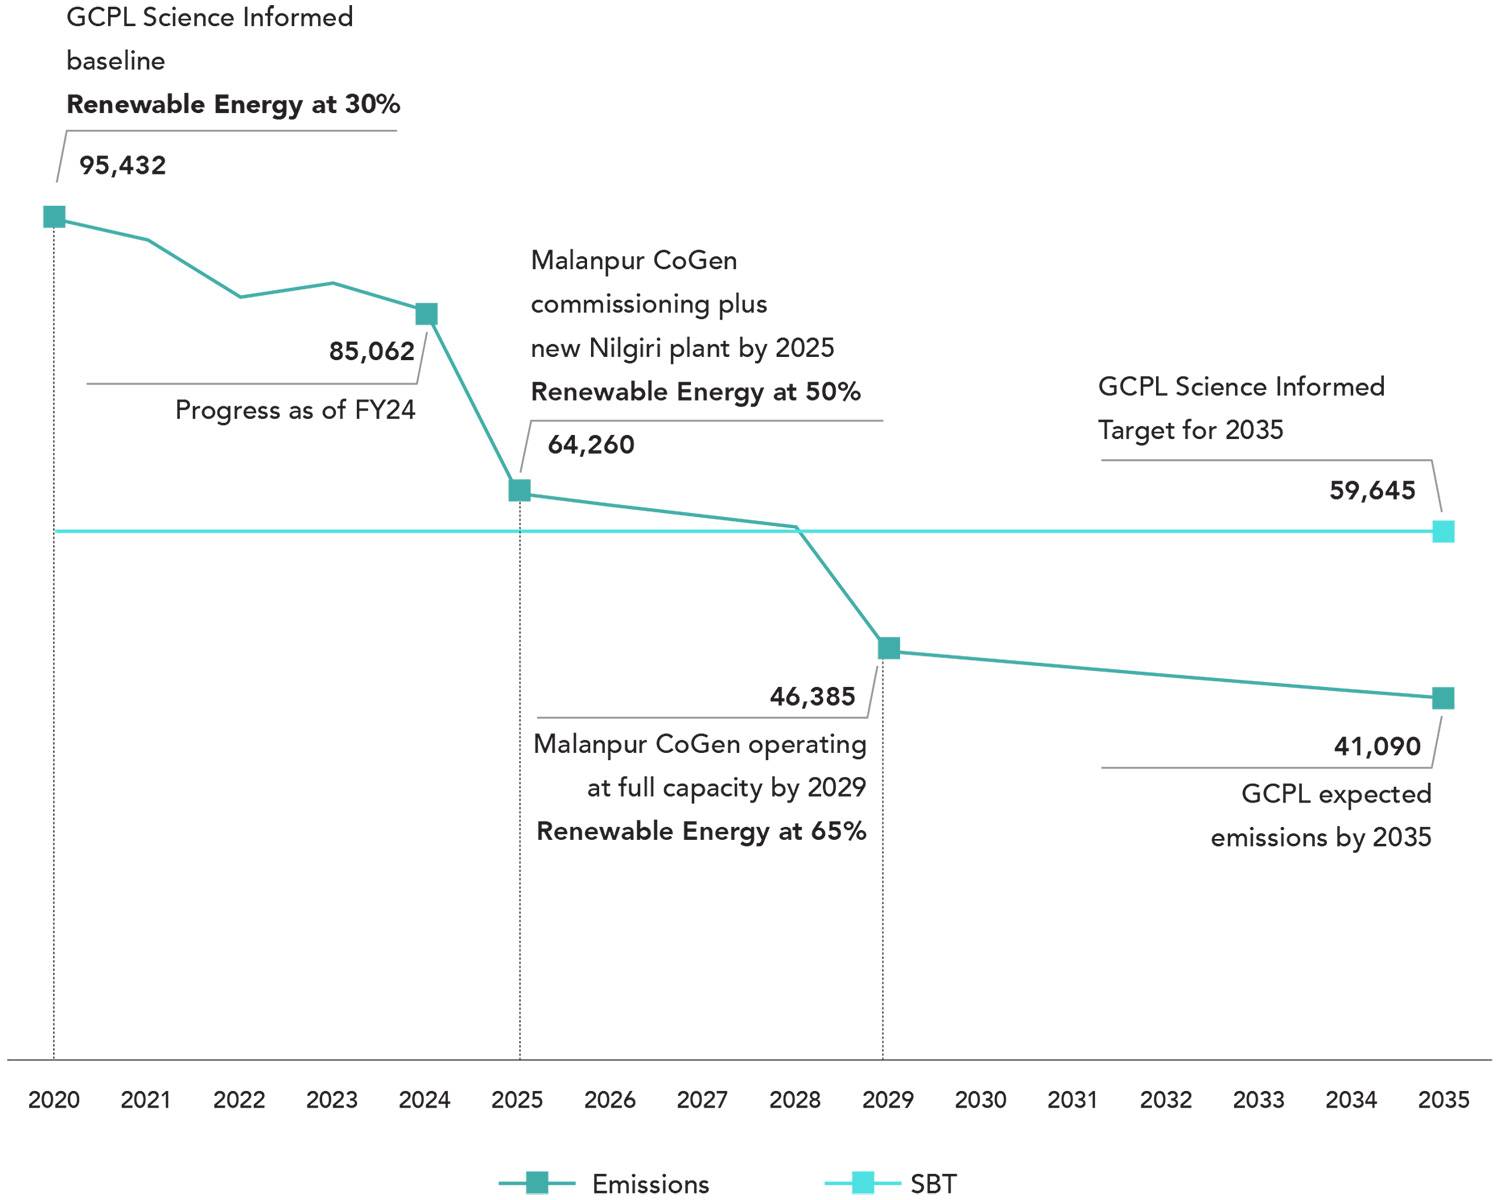
We have a three-pronged approach towards reducing our emissions and moving towards a net-zero future. Along with energy efficiency initiatives, and increasing use of renewable energy, we are also investing in community projects.
Through our waste management projects we are diverting organic waste from landfills and converting waste for biomass production. We have also invested in afforestation projects in degraded land parcels for carbon sink creation and carbon sequestration in our existing watershed
Through our waste management projects we are diverting organic waste from landfills and converting waste for biomass production. We have also invested in afforestation projects in degraded land parcels for carbon sink creation and carbon sequestration in our existing watershed projects. This not only conserves water and stores carbon but also reinvigorates natural ecosystems, preserves biodiversity, and improves livelihoods for local farmers. We are currently neutralizing 20,000 MT annually of emission equivalents through these projects. Based on the total annual emissions abatement from these initiatives and our reductions in absolute emissions, we will further invest in projects for neutralisation by our target year.
projects. This not only conserves water and stores carbon but also reinvigorates natural ecosystems, preserves biodiversity, and improves livelihoods for local farmers. We are currently neutralizing 20,000 MT annually of emission equivalents through these projects. Based on the total annual emissions abatement from these initiatives and our reductions in absolute emissions, we will further invest in projects for neutralisation by our target year.
We are also reducing our Scope 3 emissions through supplier engagement.
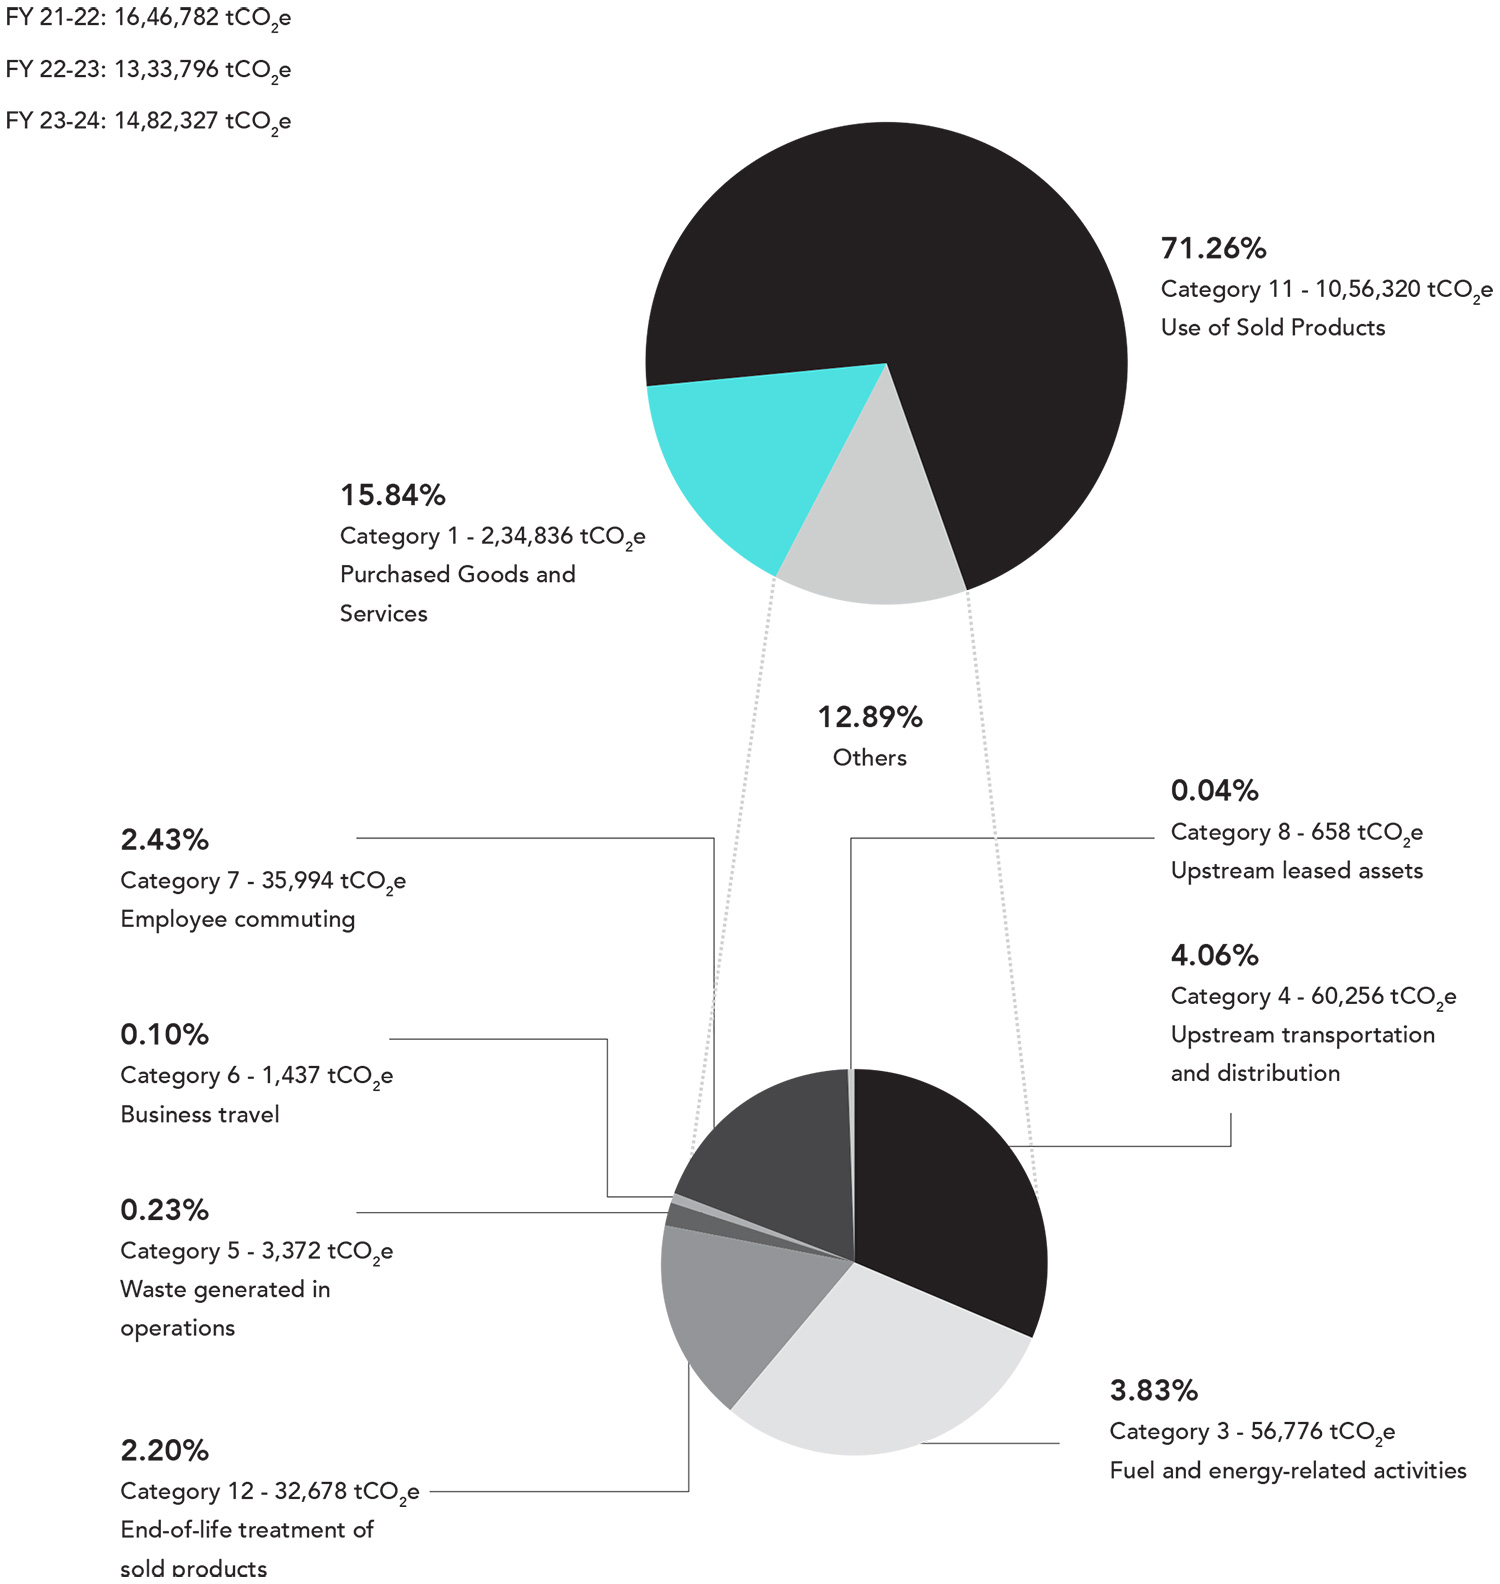
Scope 3 emissions - India (tCO2 equivalent) for FY 23-24
Our strategy for reducing emissions and moving towards net zero
carbon or carbon neutrality encompasses three key approaches :

Improving Energy Efficiency
We enhance resource efficiency across our operations to minimize energy, water, and raw material usage while maximizing productivity. This includes optimizing equipment capacity and transitioning to briquette-fired boilers over furnace oil-based ones. Collaboration with our supply chain partners under our Sustainable Supply Chain program allows for the sharing of best practices and sustainability audits.
As signatories to the EP100 global framework, developed by the Climate Group, we've committed to halving our operational energy intensity by 2030 compared to the 2012 baseline. With a current reduction of close to 40%, we are on track to meet this target well before 2030.

Increasing Use of Renewable Energy
We are ramping up our utilization of renewable energy sources such as briquette-fired boilers, microturbines, and solar PV installations. Additionally, we sell biomass ash to local farmers for use as fertilizer, promoting circularity in our operations.
Offsets
Through community-based waste management projects, we divert organic waste from landfills and invest in afforestation initiatives to create carbon sinks. These efforts not only reduce emissions but also contribute to water conservation, biodiversity preservation, and livelihood improvement for local communities.
4. Waste
Every year more than 2 billion tonnes of solid waste is generated globally, of which less than 15% is recycled. The recycling rate for plastic waste is even lower as only 9% of all plastic waste has been recycled. Waste has a significant impact on climate change. It contributes notably to greenhouse gas emissions, particularly methane from landfills.
Inefficient waste management strains our resources and results in pollution, affecting the quality of air, water, and soil. Moreover, it negatively impacts local communities and ecosystems, posing health risks and reducing the overall quality of life. It is imperative for us to implement effective waste management practices to conserve resources and protect the environment.
Scope of waste management
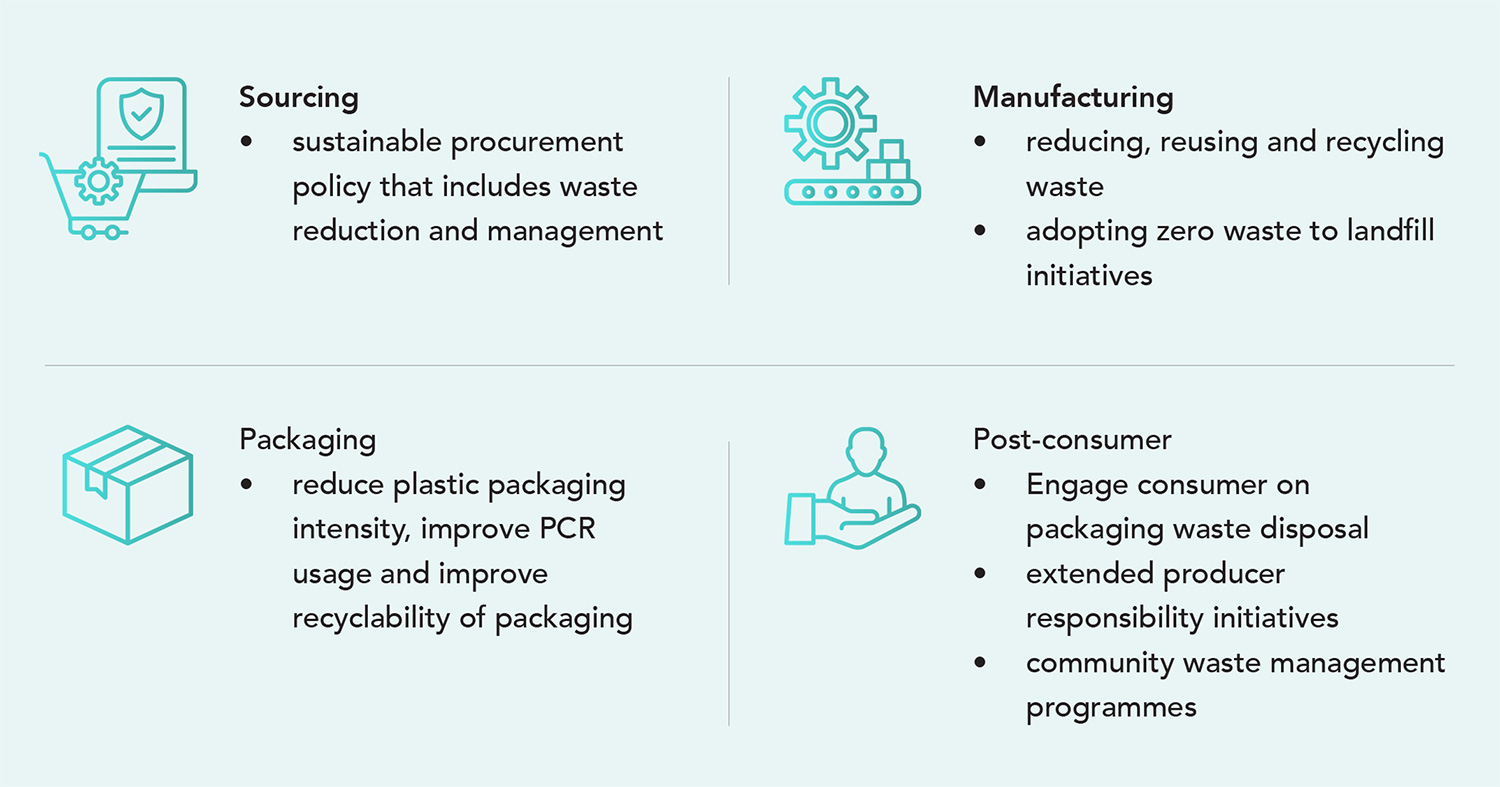
We manage all our waste throughout our value chain – from sourcing, manufacturing, packaging and post-consumer disposal. We aim to generate as little waste, reuse as much as possible and safely dispose the rest. Lowering our waste footprint enables us to not only reduce our environmental impact but also helps reduce our costs.
Waste we manage
By 2027, we aim to
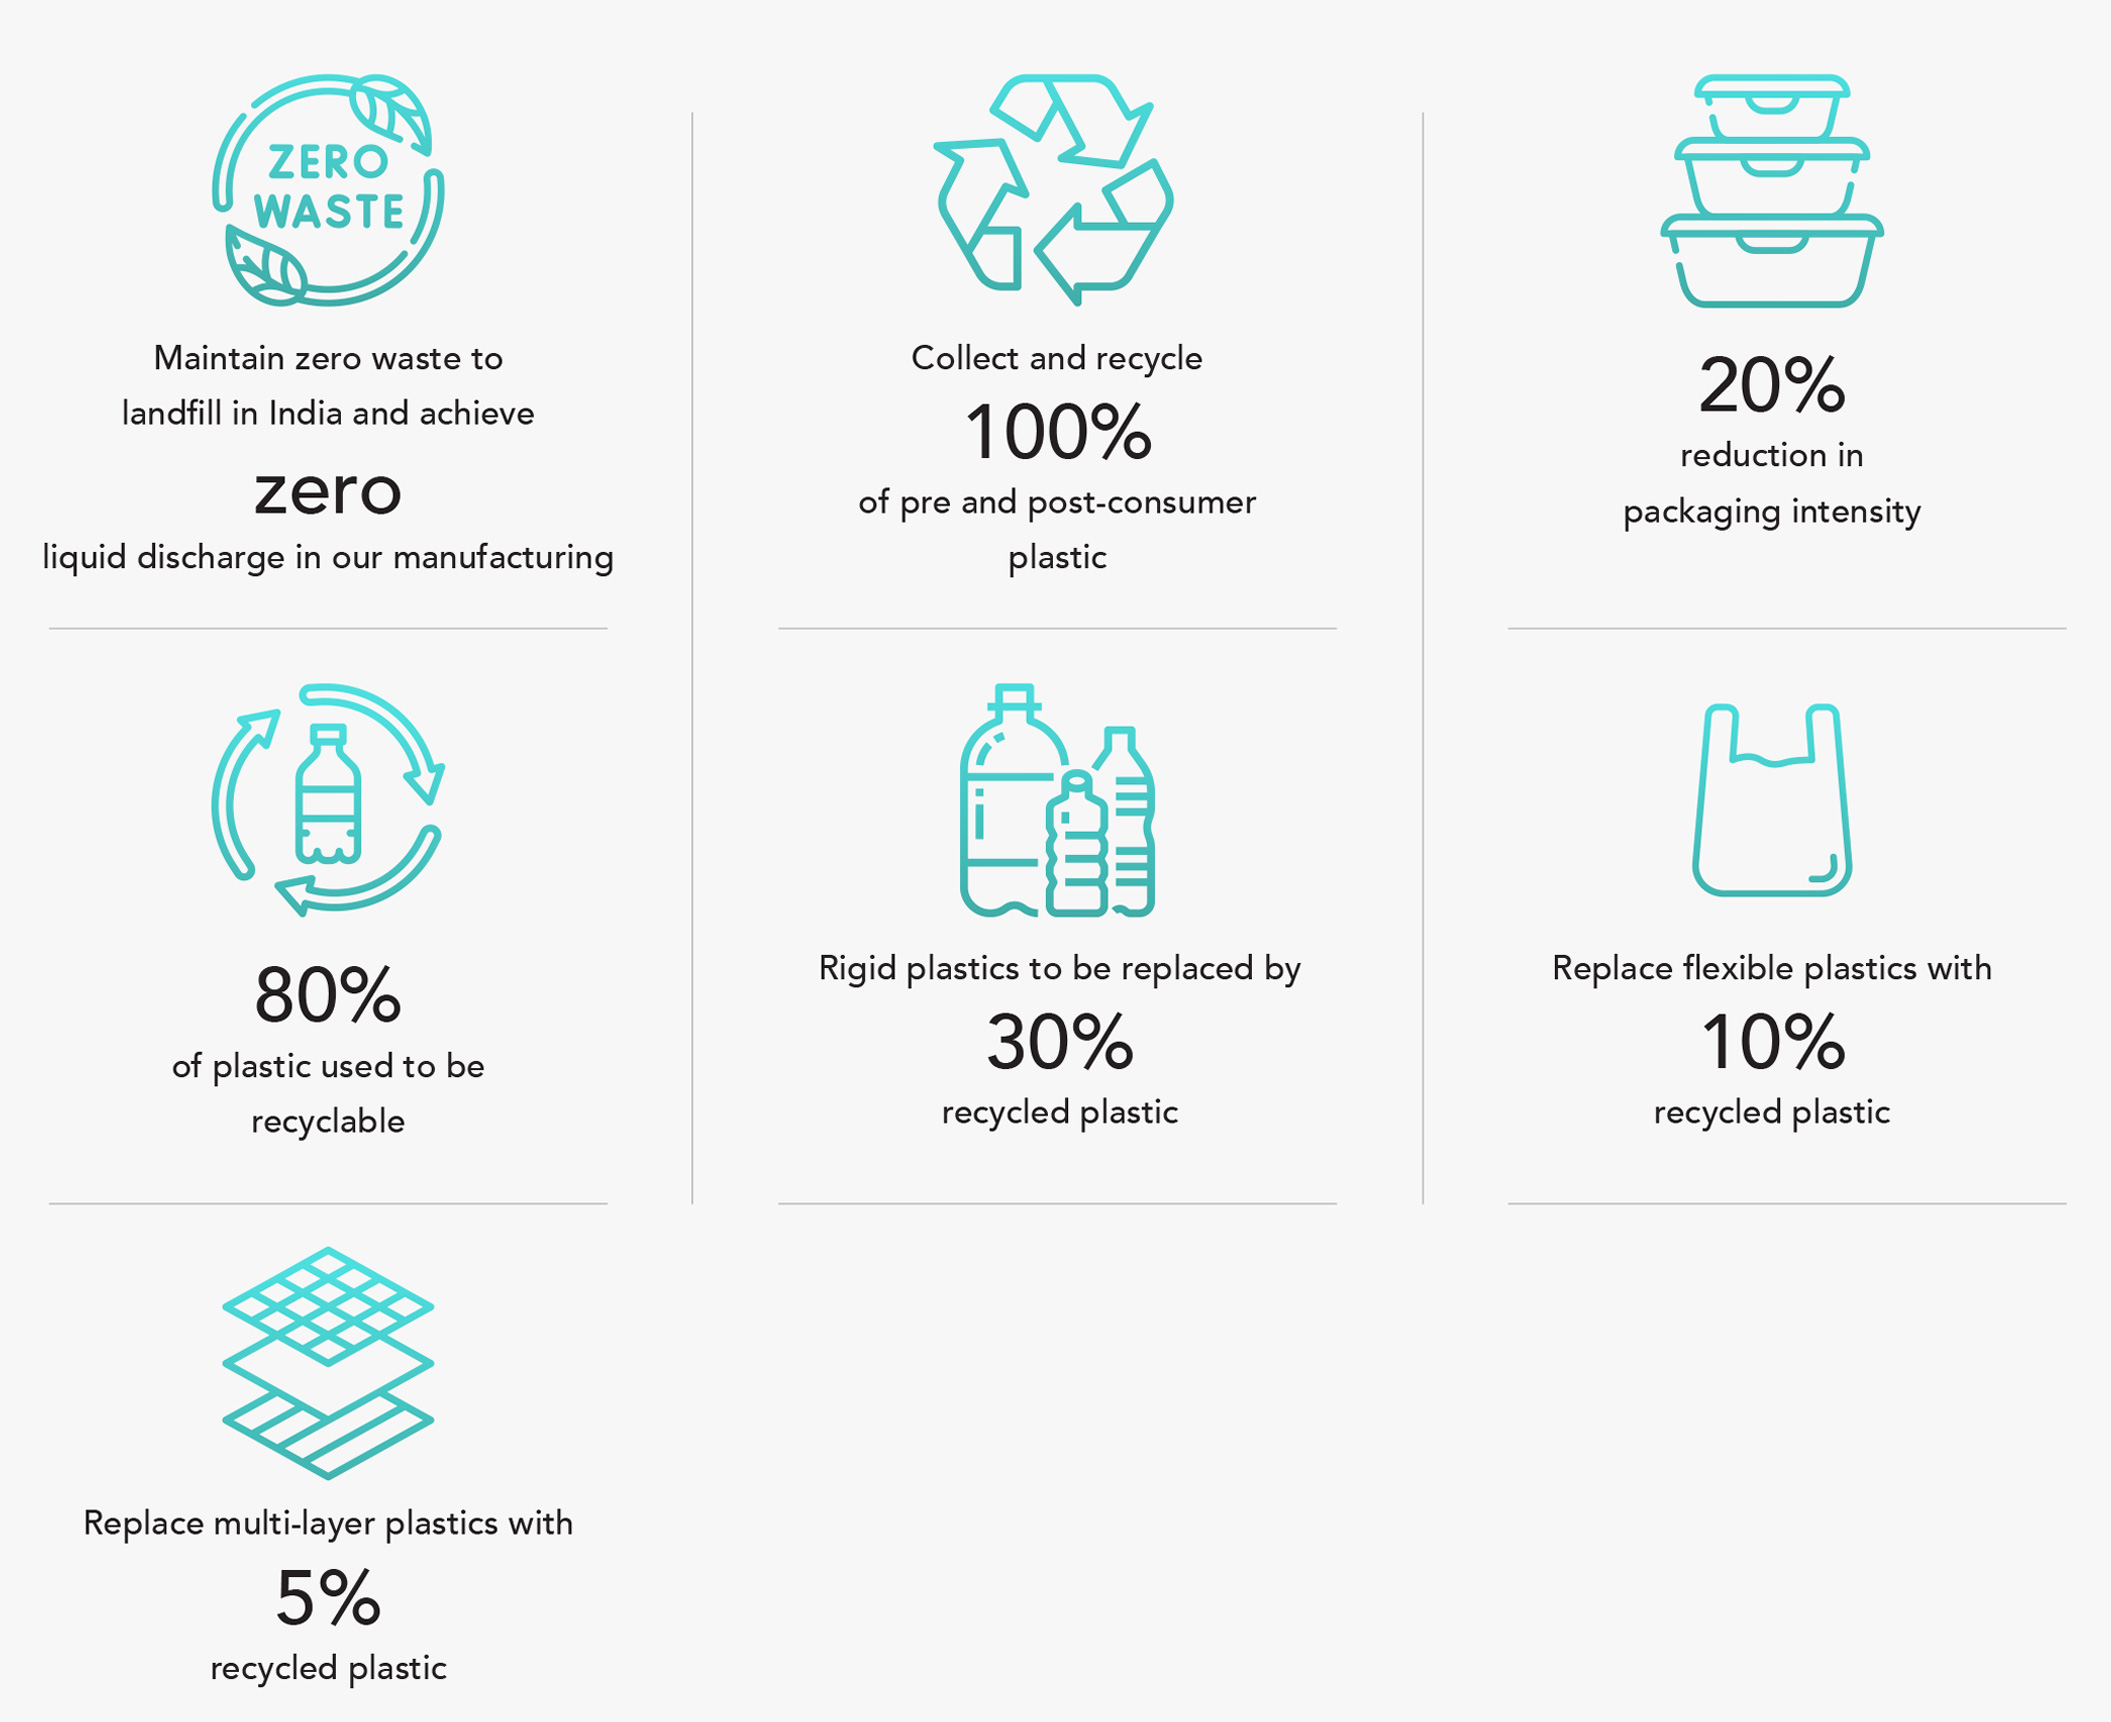
Our progress as of FY24 –

Manufacturing waste
Across our manufacturing plants, we carry out waste assessments to collect and analyse data on our waste generation, disposal practices and areas of improvement. These waste audits help us identify existing waste management practices across our operations and build action plans as per best-in-class approach. Through detailed life-cycle assessments we map waste footprint of our products from raw material sourcing to end-of-use disposal.
Each of our manufacturing sites have annual quantifiable environmental targets that includes reducing waste and diverting waste from landfills. These targets and action plans are reviewed quarterly at the plant and at the corporate level. Every six months the progress is reviewed by the Board ESG committee on our environmental goals.
We have taken several measures to reduce waste generation and adopted recycling measures to divert waste from landfills. Some of our key initiatives include –
- Our flagship Malanpur plant recycles Effluent Treatment Plant (ETP) sludge and send it for co-processing at a cement plant, helping us achieve zero waste to landfill status for our India operations.
- Our investments in R&D are focused on reducing plastic waste. We conducted successful trails with several vendors to eliminate cap poly bag liners from HIT aerosol. As a result, we were able to eliminate the liners and reduce our plastic consumption by 7.4 MT / annum.
- In Nigeria, Kenya, South Africa and Mozambique, we divert waste materials from our manufacturing plants and send for recycling. Globally, we have been able to lower our waste to landfill year-on-year.
- We maintain full compliance with Extended Producer Responsibility (EPR) regulations. Our plastic packaging footprint in India amounts to approximately 17,995 metric tons (MT). We have been maintaining plastic neutrality since FY2021, ensuring we take back of an equivalent amount of plastic that we send to our consumers. Furthermore, we actively invest in community solid waste management programmes.
Reduce, Recycle, Replace approach to sustainable packaging
Implementing a Reduce, Recycle, Replace approach to sustainable packaging is a key focus area for us. Currently, over 40% of our plastic is recyclable, and we have successfully reduced our plastic packaging intensity by 22% since the fiscal year 2019-20.
In addition to our overarching good and green targets, we have set specific sustainable packaging goals at the company level. You can find detailed information about our commitment and progress against these targets in the Radical Simplification section under Sustainable Packaging Commitment.
Highlights in sustainable packaging for the fiscal year 2023-24
Highlights from our sustainable packaging efforts in the fiscal year 2023-24 include significant achievements in reducing plastic consumption. For instance, by converting metalized cartons to non-metalized ones for our Goodknight Liquid Vapouriser refills, we not only reduced plastic packaging consumption by 3,500 MT but also decreased our Extended Producer Responsibility (EPR) obligation and achieved substantial cost savings.
Innovating for good and green products
We are dedicated to innovating for environmentally responsible products within our core categories through our ESG-first product portfolio, focusing on reconstitution and naturals ranges. By the fiscal year 2025-26, we aim to conduct Life Cycle Assessments (LCAs) for 80% of our revenue-generating products. These assessments will inform our efforts to manufacture greener products and establish a sustainable framework for all new product developments.
To further reduce our environmental impact, we are exploring alternate packaging materials and increasing the utilization of Post-Consumer Recycled (PCR) plastic to minimize our reliance on virgin plastic. Our focus extends beyond regulatory compliance with EPR guidelines to include innovations in formulation, design, and delivery models aimed at reducing our plastic footprint.
Highlights from the fiscal year 2023-24
Highlights from the year 2023-24 include completing LCAs for six products, accounting for over 50% of our revenue. Additionally, we conducted trials using PCR plastic for Goodknight Coils poly bags and explored PCR PET sources for Goodknight Xpress Liquid Vapouriser, demonstrating our commitment to green innovation and sustainable products.
You can learn more about these initiatives in the Radical Simplification section under Sustainability Built into Our Products from Day 1.
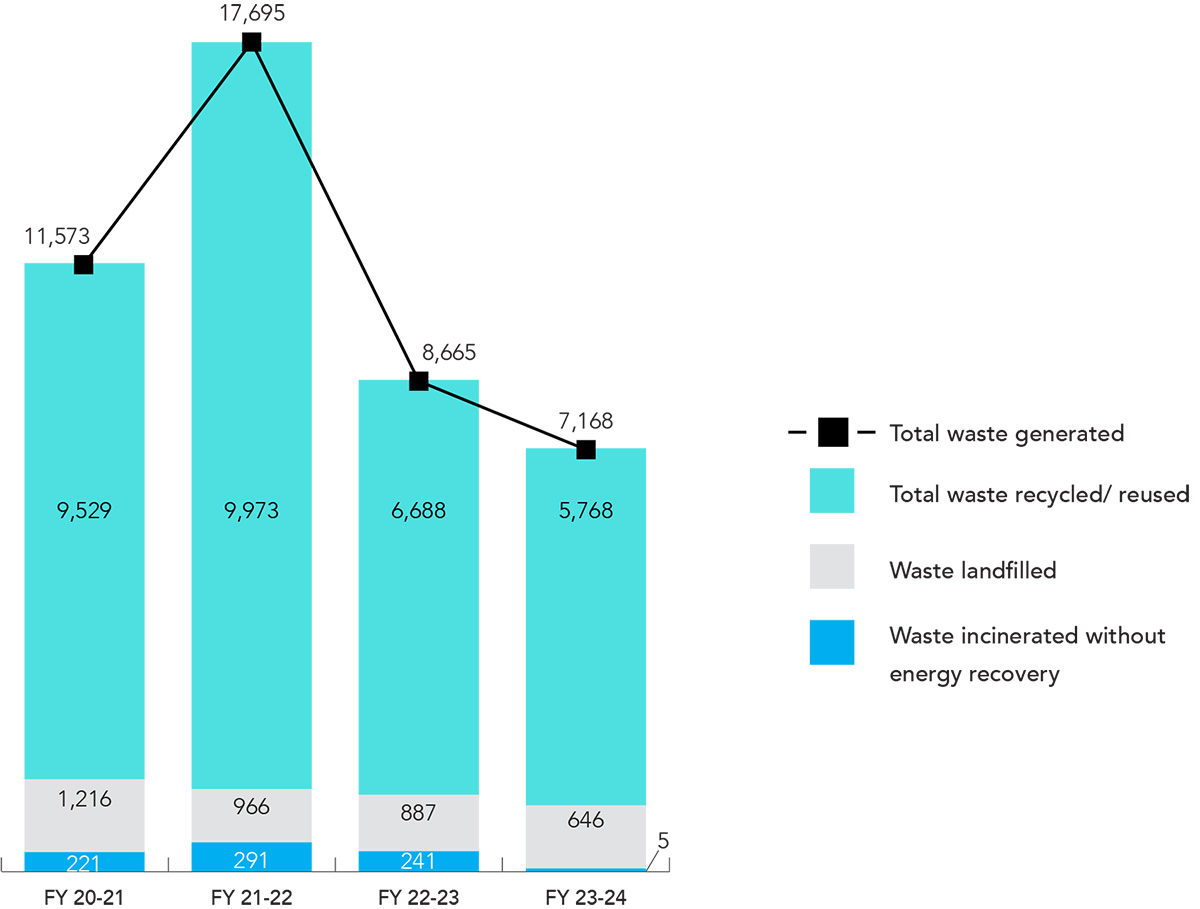
Twice a year we organise green manufacturing conference where all our green champions from across manufacturing sites gather for learning and sharing best environmental practices. As part of the learning, we create awareness on waste management programmes and bring in industry experts to share state-of-the-art technology solutions for waste reduction, and recycling. For FY2023-24, our global non-hazardous waste generated was 6,411 MT and hazardous waste was 757 MT.
Waste performance - Global (MT)
Sustainable packaging
As a consumer products company, all of our products are consumable, however we have a vital role to play in reducing the plastics and the packaging we send out. We have set clear targets to reduce our plastic usage and improve the addition of post-consumer recycled (PCR) plastics in our packaging. We have already exceeded our plastic intensity reduction targets and we are stepping up with PCR inclusion and explore alternatives to plastic. We have developed a 7-point agenda to achieve this –
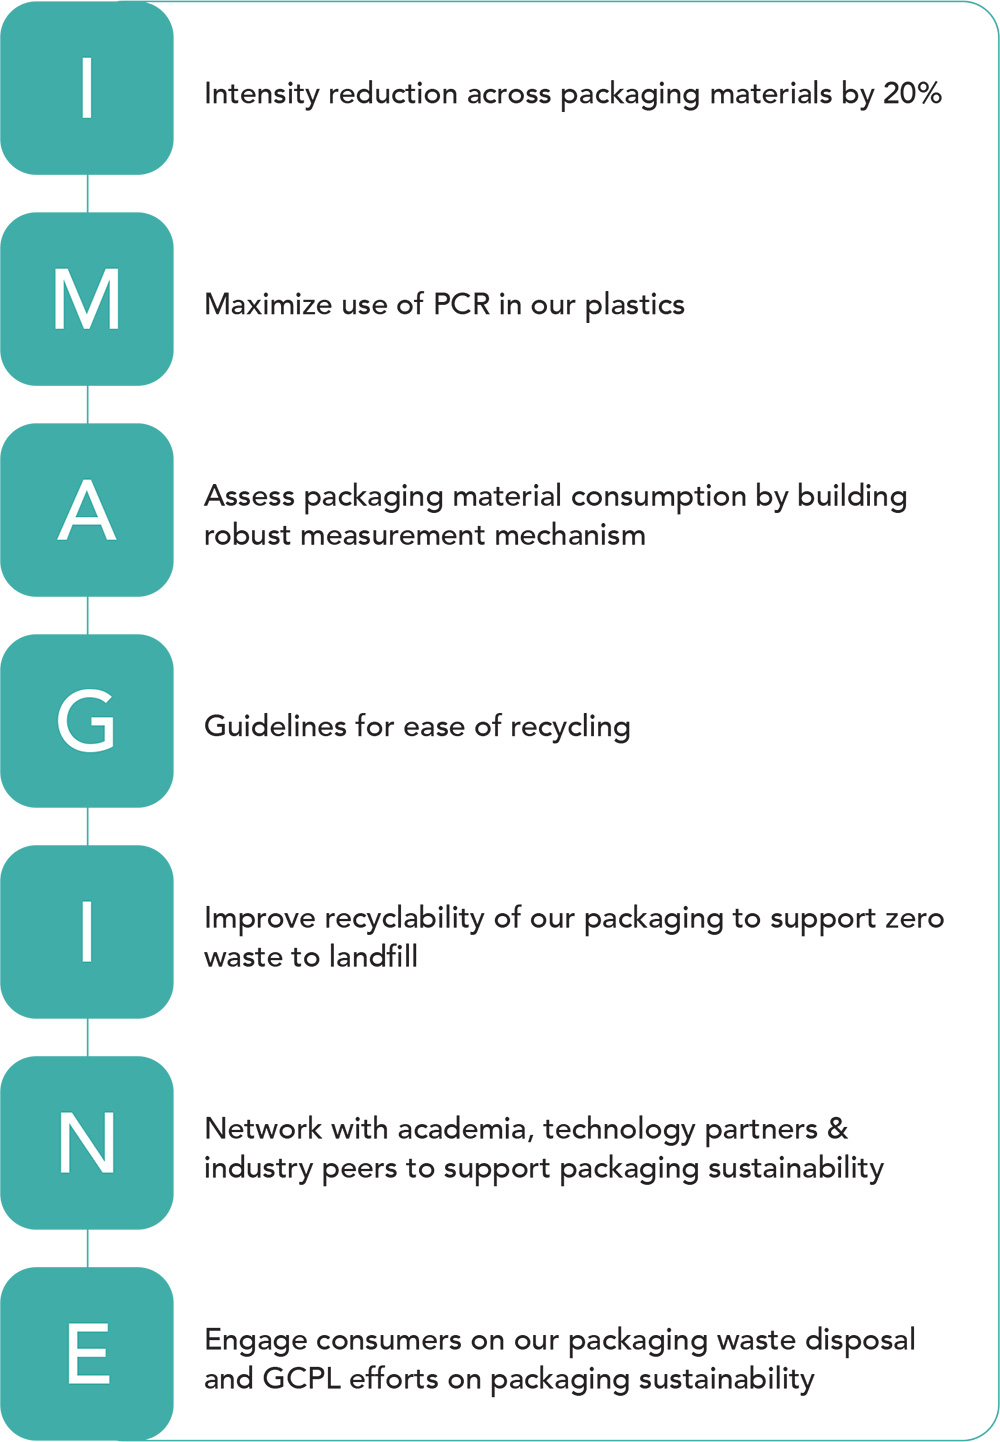
We have invested our R&D resources in making our packaging more sustainable. Moreover, the executive compensation of all GCPL leaders comprises of 15% of people & planet goals. They are in line with the company’s vision to foster an inspiring workplace and build an equitable and greener planet. For sustainable packaging, goals for executive compensation include using better plastics, reducing plastic usage, replacing virgin plastics with post-consumer recycled plastics. Our plastics and packaging programmes include –
- Increasing use of recyclable packaging - We aim to have 80% of our plastic packaging recyclable and we are currently at about 40%. We have mapped 16 products in our portfolio to achieve our target by switching to recyclable packaging material like aqueous coatings, paperboards and BOPP.
- Using reusable packaging – The cartons, bags and corrugated boxes that are used in our supply chain are reused multiple times in our operations. For example, corrugated boxes that we use are recycled and they are reused at least four times to lower our environmental impact.
- Inclusion of recycled materials – We are testing and running trails to include PCR in our packaging. In our products such as Ezee liquid detergent bottle, Good knight LV bottles, HIT cap, we are testing to replace 10%-50% virgin plastic with PCR.
- Phasing out single-use plastic – From our offices and manufacturing plants we are phasing out single-use plastics. At our head office we have already phased out single-use plastics. All our garbage bags, stationery and office use items are recyclable r made from biodegradable materials. We are now working with our suppliers to ensure we phase out single-use raw material packaging that we use in our operations.
Packaging Materials - Wood/Paper fiber packaging
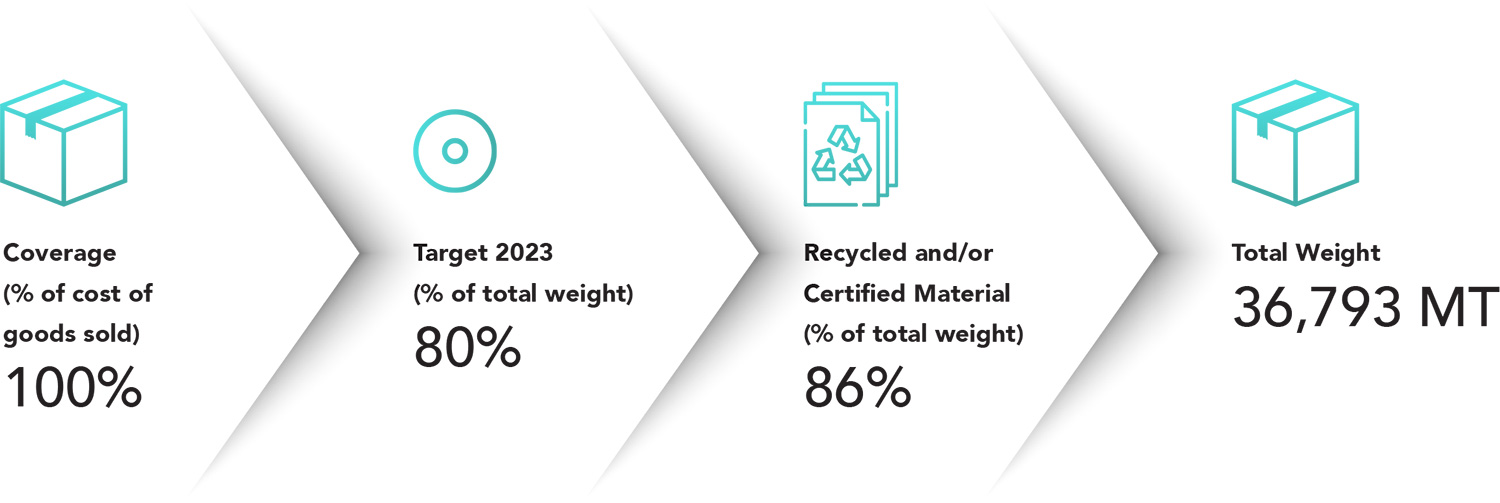
Plastic packaging
| FY 2020 | FY 2021 | FY 2022 | FY 2023 | What was your target for FY 2023? |
|
|---|---|---|---|---|---|
| A. Total weight (tonnes) of all plastic packaging |
19,541 | 19,500 | 18,750 | 17,995 | 18,500 |
| B. Percentage of recyclable plastic packaging (as a % of the total weight of all plastic packaging) |
30 | 30 | 34 | 40 | 40 |
| Coverage (as a % of cost of goods sold) |
100% | ||||
Impact initiative
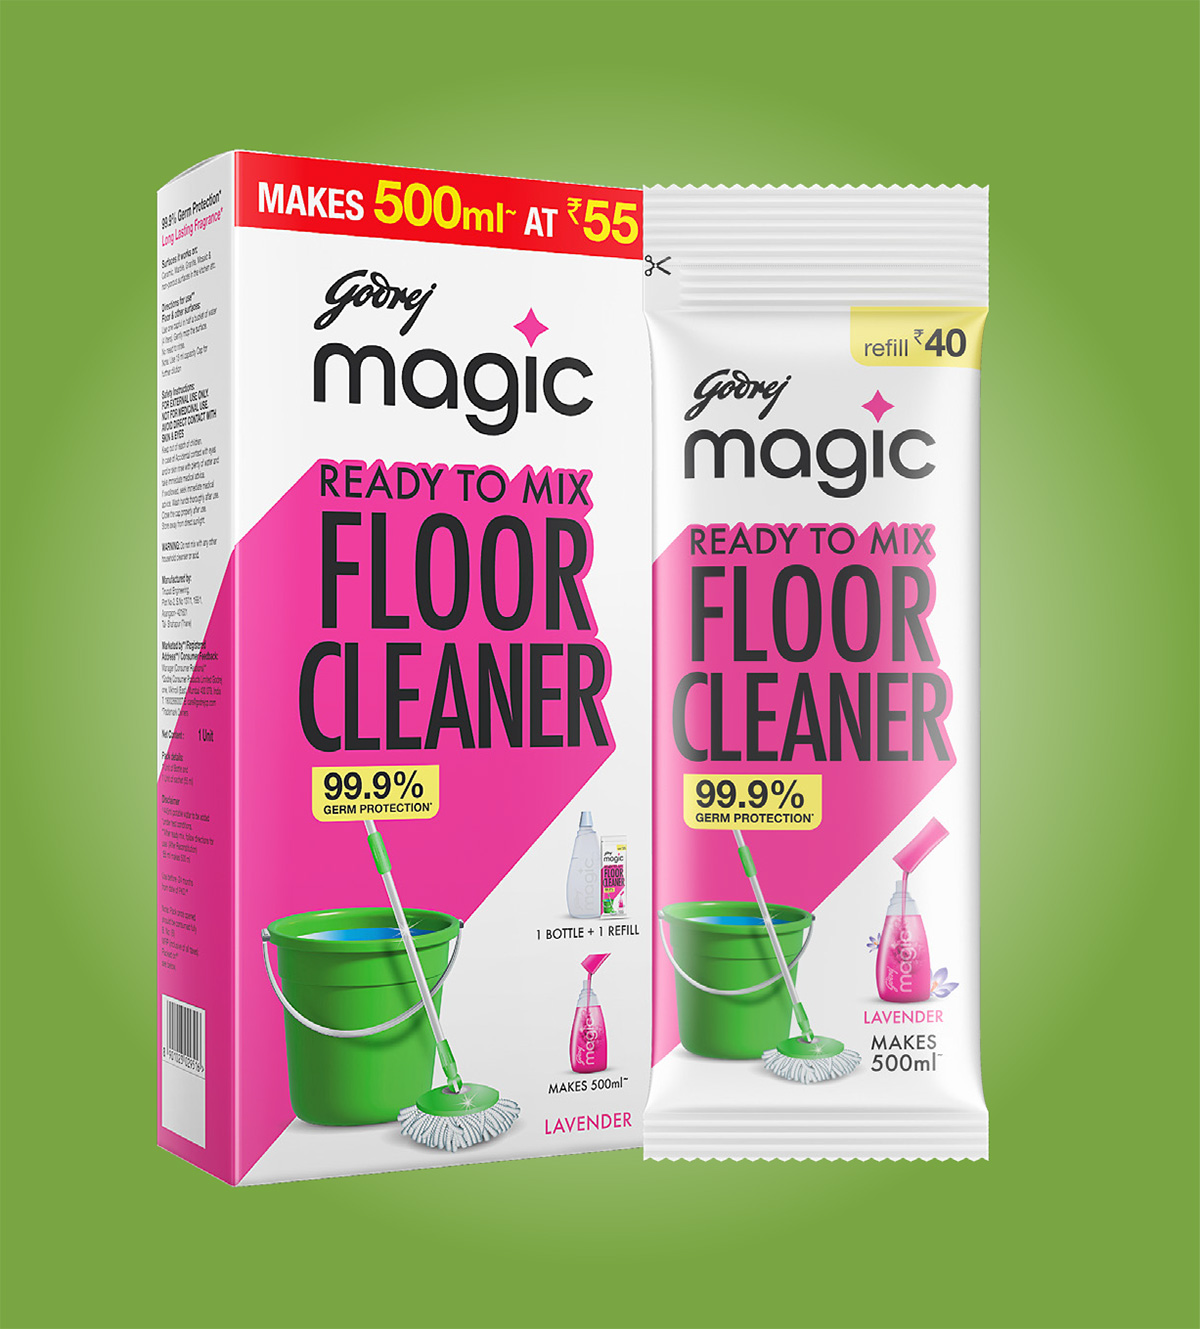
Our Godrej Magic Floor Cleaner offers an affordable and sustainable solution. By mixing one sachet with water one can create a 500ml bottle of floor cleaner at a budget-friendly price. Our product drastically reduces plastic waste and energy consumption. Compared to traditional cleaners, it uses 94% less plastic and 72% less paper in packaging. Moreover, its compact gel-based sachets allow more units per truck, reducing transportation and emissions and lowering our environmental impact.
Post-consumer packaging waste and community solid waste and
plastic management
As a global FMCG player and responsible corporate, we commit to reducing waste across all our plants, processes, products, and supply chain. For the past five financial years, we have achieved zero waste to landfills from our manufacturing in India. Beyond managing our manufacturing waste, we recognise our responsibility to work with communities to manage waste. We collect 100% of the plastic waste we generate each year, as per Indian EPR laws, and collaborate with civic agencies, social enterprises, and citizens’ groups to promote material reuse and recycling.
We also invest in helping communities around our offices and plant locations to identify and address their waste-related issues using circular economy principles. Since FY 2020-21, we have partnered with the Puducherry Municipal Corporation on a community waste management project. We digitally track waste management processes, raise awareness on door-to-door collection and source segregation, and have diverted over 1,400 MT of waste from landfills through clean-up drives and door-to-door collection. We established a sanitation park processing 4 TPD of waste and provided medical camps for over 1,100 waste workers. Our detailed project plan for sustainable waste management has influenced new tenders from the Government of Puducherry.
Our three-year project with Malanpur Nagar Parishad covers all 15 wards, aiming for zero waste to landfill and breaking even on operational costs by the third year. As of FY 2023-24, we diverted over 1,300 MT of waste from landfills.
Our integrated decentralized solid waste management system in Palashbari Municipal Board, Kamrup district, Assam. This project, covers all 10 municipality wards and surrounding commercial zones, aiming to break even on operational costs. Till FY 2023-24, it diverted over 2,200 MT of waste from landfills.
In In Kasauli, Solan district, Himachal Pradesh, we launched a municipal waste management project to tackle the increasing garbage issues impacting the area's natural beauty. In FY 2022-23, we conducted a baseline assessment in the Kasauli cantonment area and five surrounding Panchayats. In FY23-24 we organised cleaning drives, established waste-themed art installations, and engaged school children to raise awareness, diverting 652 kgs of waste.
In Goa, we partnered with the Goa State Pollution Control Board and Goa Waste Management Corporation on a three-year waste management project with Bicholim and Sattari Municipal Councils. Implemented by the Mineral Foundation of Goa and Sampurn(E)arth. As of FY 2023-24, we diverted over 1,400 MT of waste from landfills.
Overall, our community solid waste management programmes ensured that recyclable packaging is actually recycled through scientific waste management systems and collaboration with municipalities and urban local bodies. We helped diverted 7,200 MT of waste from landfills since 2019 and our goal is to transform waste management systems in five municipalities and divert over 8,000 MT of waste from landfills by FY 2025-26 through collaborative partnership.
Establishing winning products in new geographies
GCPL's presence spans some of the largest and most rapidly expanding emerging economies globally. Despite this, our primary categories in these regions, such as Household Insecticides, Air Care, and Hair Colour, remain relatively untapped, presenting significant growth potential. We view this as an opportunity for generating value by applying our strategies for category development, leveraging our expertise in roduct innovation, communication, and activations.
Our focus is on crafting products that resonate with local market preferences while also possessing the potential for global appeal. This approach allows us to harness our resources to create breakthrough innovations capable of traversing international boundaries, seizing global market opportunities, and ensuring sustained competitiveness in the long term.
We have already set the groundwork to realize this objective by introducing Magic, our innovative powder-to-liquid handwash, across diverse regions including India, Africa, Indonesia, and Latin America, establishing it as our maiden global offering. Similarly, our entry into the Household Insecticides segment in Africa through the introduction of Goodknight Power Shots exemplifies our commitment to this strategic direction.
Addressing unmet
consumer needs
We value our consistent track record of disruptive innovations, enabling us to venture into new categories and cater to unfulfilled consumer demands. This endeavour has frequently resulted in the creation of new, unique brands that leave a lasting impression.
Our innovation evaluation process is rigorous, incorporating extensive consumer trials and test markets. This stringent approach guarantees that only the most promising products make it to market. By doing so, we enhance the likelihood of success, ultimately yielding higher returns on investment and fostering long-term value for our stakeholders.
We launched a new liquid detergent
brand - Godrej Fab - for mass market

Enhanced, digitally
enabled consumer insight
Continuing our commitment to consumer-centricity, our innovation strategy remains focused on enhancing consumer insight capabilities. This empowers our innovation team to craft products and solutions that precisely align with consumer needs and preferences.
Key aspects of our enhanced consumer insight capabilities include:


1. Global Structure
We maintain a global category structure that encourages the exchange of insights and expertise across the organization. This fosters better-informed decision-making and strategic planning by tapping into a wealth of knowledge.


2. Standardised testing protocols
Clear global testing protocols and action standards ensure consistent, high-quality evaluation of our products and innovations. This minimizes risks and enhances our chances of success in the market.


3. Strong agency partnerships
Strengthening our relationships with critical agency partners enables us to leverage their expertise and global reach. This enriches our intellectual capital and aids in developing products tailored to diverse consumer preferences.


4. Digital techniques
Harnessing modern digital techniques for consumer insights allows us to gather real-time data and identify emerging trends swiftly. This agility provides us with a competitive edge and enhances our long-term growth potential.
Investments in R&D, design,
technology, and skills
Situated at our global headquarters, Godrej One, in Mumbai, our state-of-the-art R&D centre is a cornerstone of our innovation ecosystem. Supported by local R&D teams, it fosters collaboration across geographies, facilitating the sharing of insights and best practices.
At our in-house global Design Lab, we seamlessly integrate design thinking into our processes, thereby enhancing our product capabilities. Unlike the common practice in the FMCG industry, where this capability is often outsourced, we have chosen to cultivate it internally, turning it into a distinct competitive advantage.
Comprising highly skilled graphic and industrial designers from various regions, the lab functions as a hub for collaborative projects, driving innovation and creativity across our product portfolio.
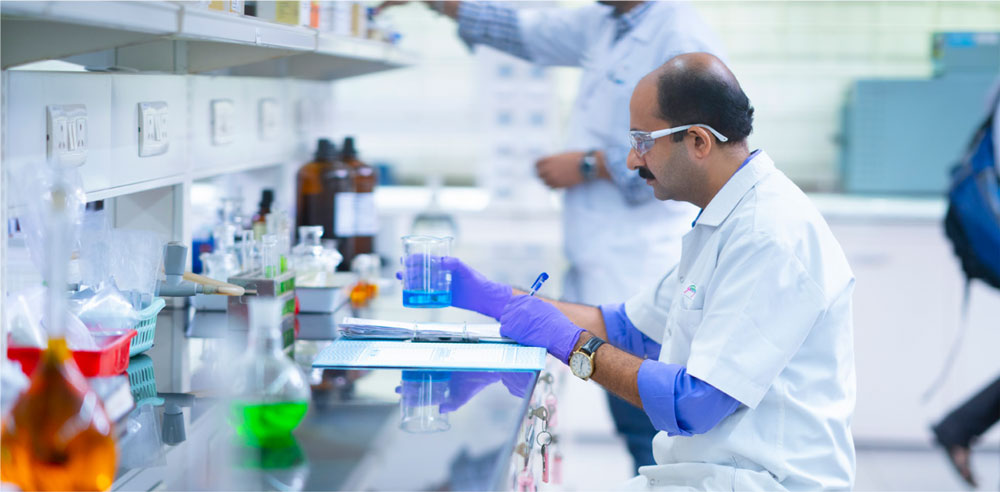
Our state-of-the-art global R&D centre at
our headquarters, Godrej One in Mumbai is
where we lead new product development.
Sustainability built into our
products from Day 1
We maintain a continuous focus on the sustainability of our products, examining their life cycle to refine and bolster our NPD framework. This process is enriched by both quantitative and qualitative insights gathered from market research, focus groups, consumer panels, and analytics.
Our R&D remains pivotal in crafting innovative, high-quality products that serve the dual purpose of benefiting people and the planet.
1. Reconstitution portfolio
Our reconstitution portfolio holds a significant position in our endeavor to create innovative, top-quality products that offer advantages to both our customers and the environment. Recognizing the considerable water content in personal care products, we address the associated environmental impact of shipping water-intensive products. Our Magic Handwash and Magic Bodywash exemplify this
Our reconstitution portfolio holds a significant position in our endeavor to create innovative, top-quality products that offer advantages to both our customers and the environment. Recognizing the considerable water content in personal care products, we address the associated environmental impact of shipping water-intensive products. Our Magic Handwash and Magic Bodywash exemplify this approach. They are designed as powder-to-liquid or concentrate solutions, empowering consumers to add water themselves, thereby transforming the product into a usable liquid form. This innovative strategy not only reduces transportation weight but also lessens the environmental footprint typically associated with traditional product formulations.
approach. They are designed as powder-to-liquid or concentrate solutions, empowering consumers to add water themselves, thereby transforming the product into a usable liquid form. This innovative strategy not only reduces transportation weight but also lessens the environmental footprint typically associated with traditional product formulations.
With Magic powder-to-liquid handwash, our sustainable and affordable
solution to handwashing, we are driving change in consumer behaviour
and fostering a greener, more responsible market.

This approach brings significant benefits to the environment. Firstly, by eliminating water from our products, we reduce their overall weight, enabling us to transport larger quantities with fewer packaging materials. As a result, our reconstituted products require 84% less plastic packaging compared to their traditional liquid counterparts of the same volume. This reduction in packaging not only minimizes plastic waste but also contributes to a more sustainable supply chain. Secondly, the lighter weight of our reconstituted products leads to a 44% decrease in fuel consumption during transportation, subsequently reducing emissions by the same percentage. By curbing packaging, fuel consumption, and emissions, we actively promote environmental well-being while maintaining our commitment to delivering top-notch products to our consumers.
Usually, environmentally friendly products and packaging are associated with higher prices, appealing mainly to a niche market of environmentally conscious consumers. However, we firmly believe in making sustainable choices accessible to a wider audience. Our products are affordably priced, and we are dedicated to offering our innovative, eco-friendly products at a "green discount" rather than at a premium. We aim to make sustainable options more appealing and affordable, instigating positive changes in consumer behaviour and nurturing a greener, more responsible market.
2. Natural portfolio
We have dedicated ourselves to developing products crafted primarily with natural ingredients, a move aimed at setting our offerings apart from those already saturating the market and improving our position within it. Across our product categories, we have ensured the introduction of at least one natural product.
In the realm of Household Insecticides, a category subject to stringent regulations, we encounter a proliferation of counterfeit mosquito-repellent incense sticks (agarbattis) flooding the market. These products often conceal ingredients and harbour harmful chemicals, failing to meet the safety standards set by the Government of India. Their regular inhalation poses significant health risks, particularly to vulnerable demographics such as children and the elderly. In contrast, our Goodknight Naturals Neem Agarbatti is formulated with 100% natural neem and turmeric, effectively repelling mosquitoes while adhering to all requisite governmental approvals. Additionally, our commitment to natural ingredients extends across our Household Insecticide range, including Goodknight coils, liquid vaporizers, and personal mosquito repellents.
Furthermore, our hair colour brand, Godrej Nupur, boasts a natural henna-based formula. In regions like Africa and Indonesia, represented by brands such as TCB, Megagrowth, African Pride, Stella, and Mitu, we offer variants enriched with natural ingredients like aloe vera and almond. This concerted effort underscores our dedication to providing safe, effective products infused with the goodness of nature.
Goodknight Naturals Neem Agarbatti is
made of 100% natural neem and turmeric

Supply chain
sustainability
Aligned with our Good & Green goals, established in 2015, we have established clear sustainability criteria for our suppliers, outlined in the GCPL Sustainable Procurement Policy. We hold all key suppliers accountable for adhering to these standards and are dedicated to supporting them in achieving compliance. Both existing and prospective suppliers are required to meet the outlined expectations delineated in the Policy.
Our commitment extends to assisting our suppliers in enhancing the sustainability of their operations, with a particular focus on four key parameters:


Ethically driven
- Business integrity
and ethics - Human
rights
- Accountability and responsibility
- Legal and regulatory compliance


Social focused
- Responsible conduct with stakeholders
- Employee health and safety
- Local community development


Green inspired
- Green products and processes
- Reduce, reuse, and recycle
- Adopting green initiatives and practices


Quality Centred
- Quality management systems
- Facility and machinery
- GMP and
quality controls - Material
management
Within our supplier evaluation framework, we have gathered both qualitative and quantitative data to formulate a comprehensive composite score derived from supplier responses. To drive continual adherence, we have instituted self-declarations from suppliers, supplemented by external audits conducted by a reputable consultant. Moreover, we have delineated category-specific targets, disseminated industry benchmarks, and recommended corrective measures and enhancement strategies.
The Board ESG Committee receives regular updates on the progress of supplier evaluations, underscoring our commitment to accountability. Through these measures, we ensure suppliers align with our Sustainable Procurement Policy and its accompanying code, thereby mitigating any potential conflicts with ESG requirement.
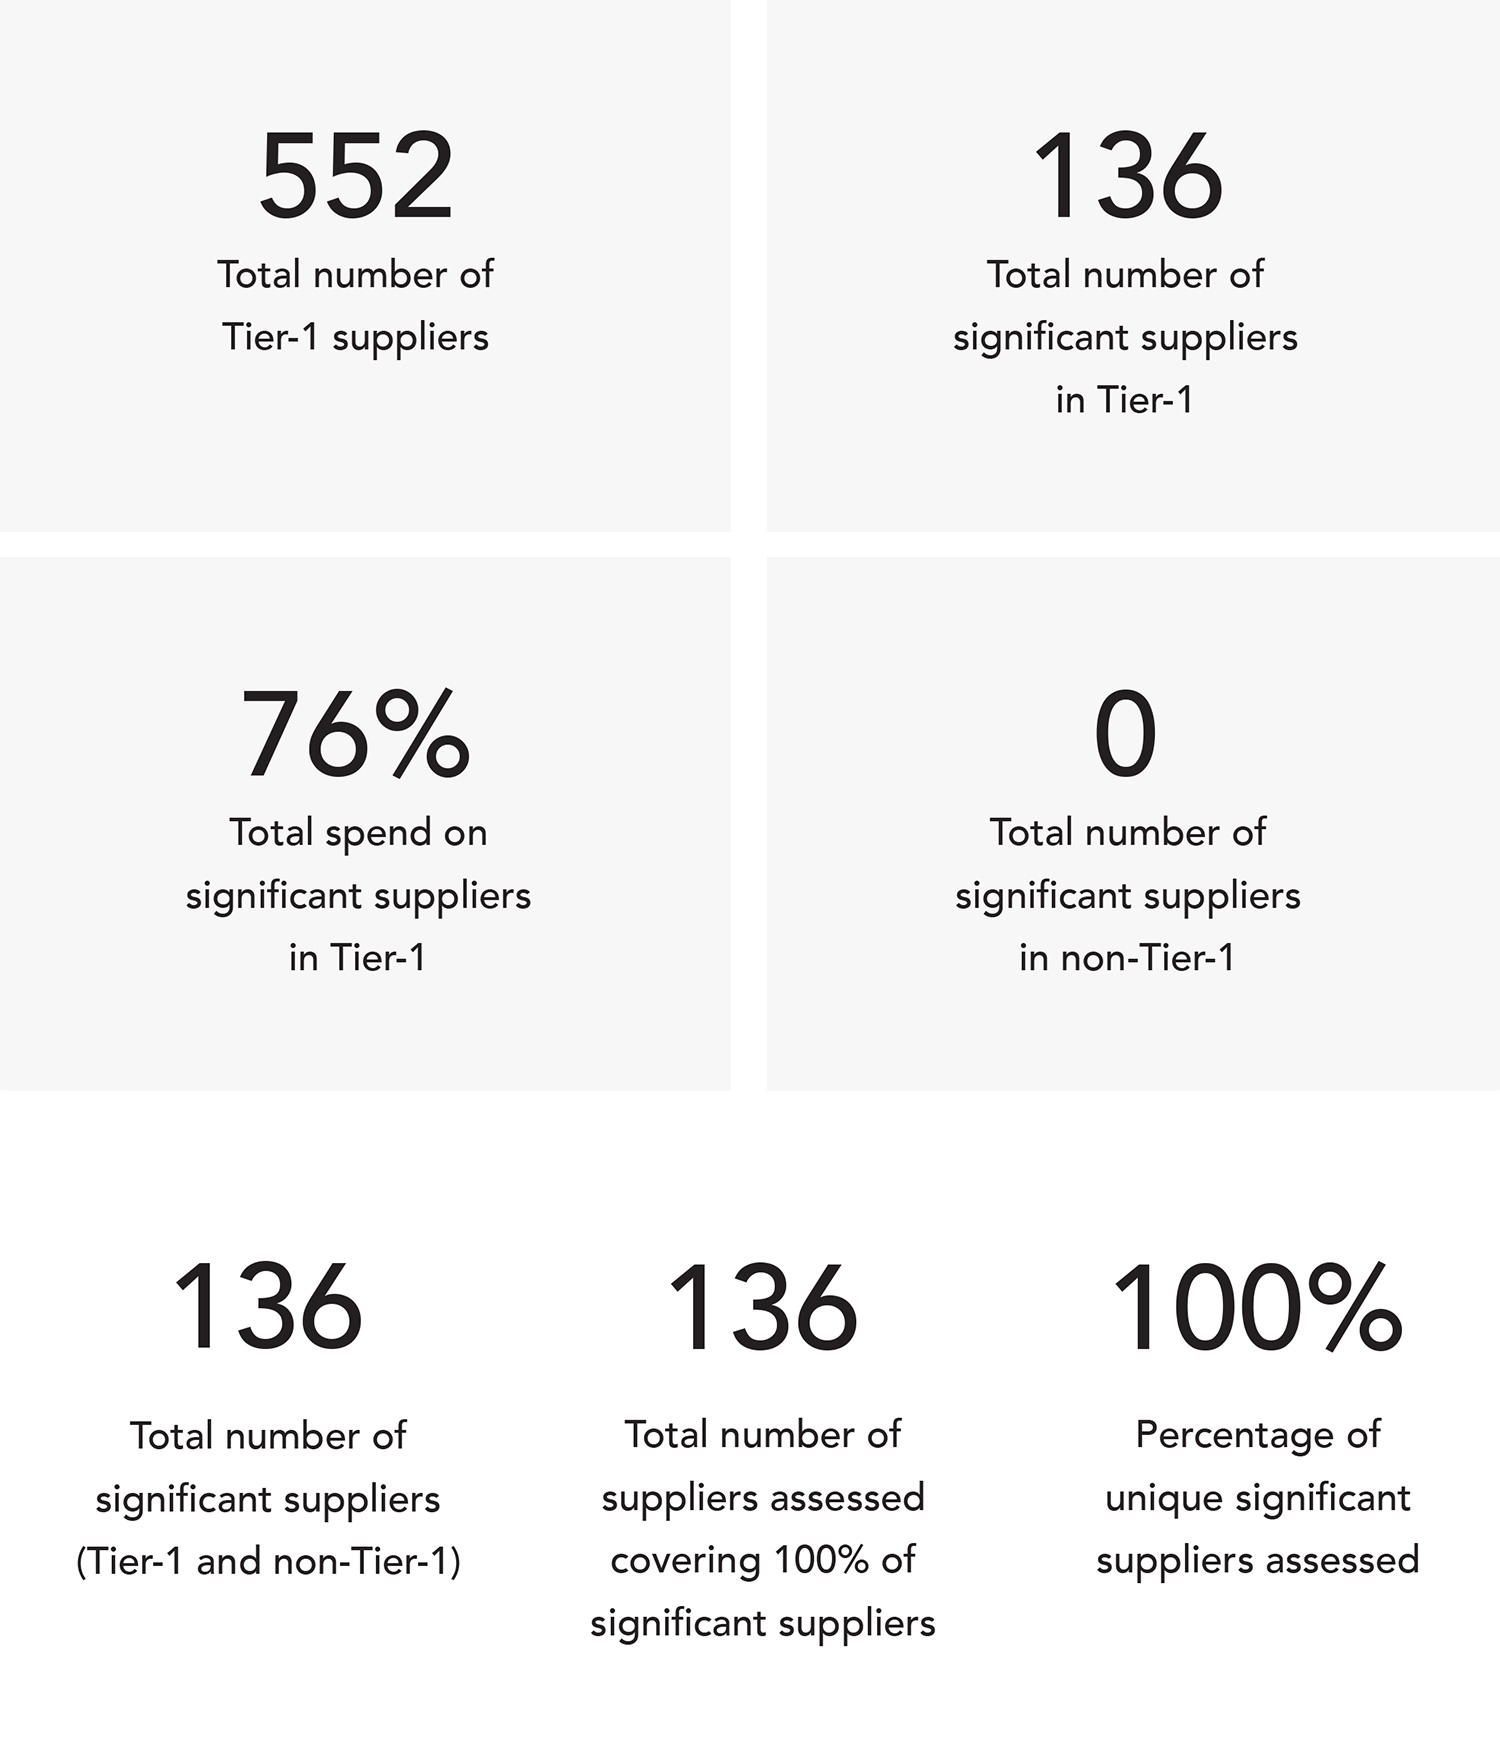
As part of our supplier evaluations in India, we assessed 136 suppliers during the fiscal year 2023-24, representing approximately 76% of our procurement expenditures. Of the 136, we organised on-site assessment for 8 suppliers. These assessments, conducted by an external consultant, adhered to global standards such as ISO 9001, 28000, 45001, SEDEX, EcoVadis, and SEBI’s Business Responsibility and Sustainability Reporting framework. The assessments focused on alignment with our sustainable procurement policy and our commitments to quality, ethical practices, environmental consciousness, and social responsibility. Our assessments consider ESG risks from suppliers based on country, sector, and commodity, including chemicals, corrugated boxes, dyes and colours, ceramic components, aluminium tins, and electrical components. Among 106 vendors with historical scores, 42% showed improvement in their average scores. Notably, none of the vendors exhibited non-compliance or significant negative impacts hence no suppliers were put on corrective plan or were terminated.
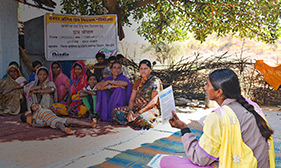
We initiated capacity building for suppliers and internal stakeholders to advance their sustainability journey. 71 unique suppliers, representing 52% of our Tier-1 suppliers, participated in training covering sustainability, ESG initiatives, human rights, biodiversity, and environmental parameters like extended producer responsibility and greenhouse gas emissions.
We share industry best practices and recommended actions for improvement. Sustainability assessments through a self-declaration questionnaire are part of our new vendor initiation protocol, reinforcing our commitment to sustainable practices. We annually review procurement practices to ensure alignment with our Sustainable Procurement Policy and track supplier progress to the green zone. In FY23-24, 25.4% of suppliers achieved more than a 25% score increase, with over 56% in the green zone.
Score category -wise no. of suppliers
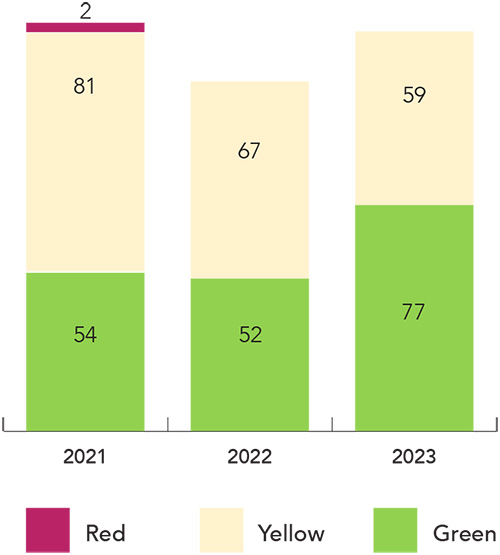
Supplier screening for fiscal year 2023-24
