
Manufactured
Capital

Intellectual
Capital
Key enablers
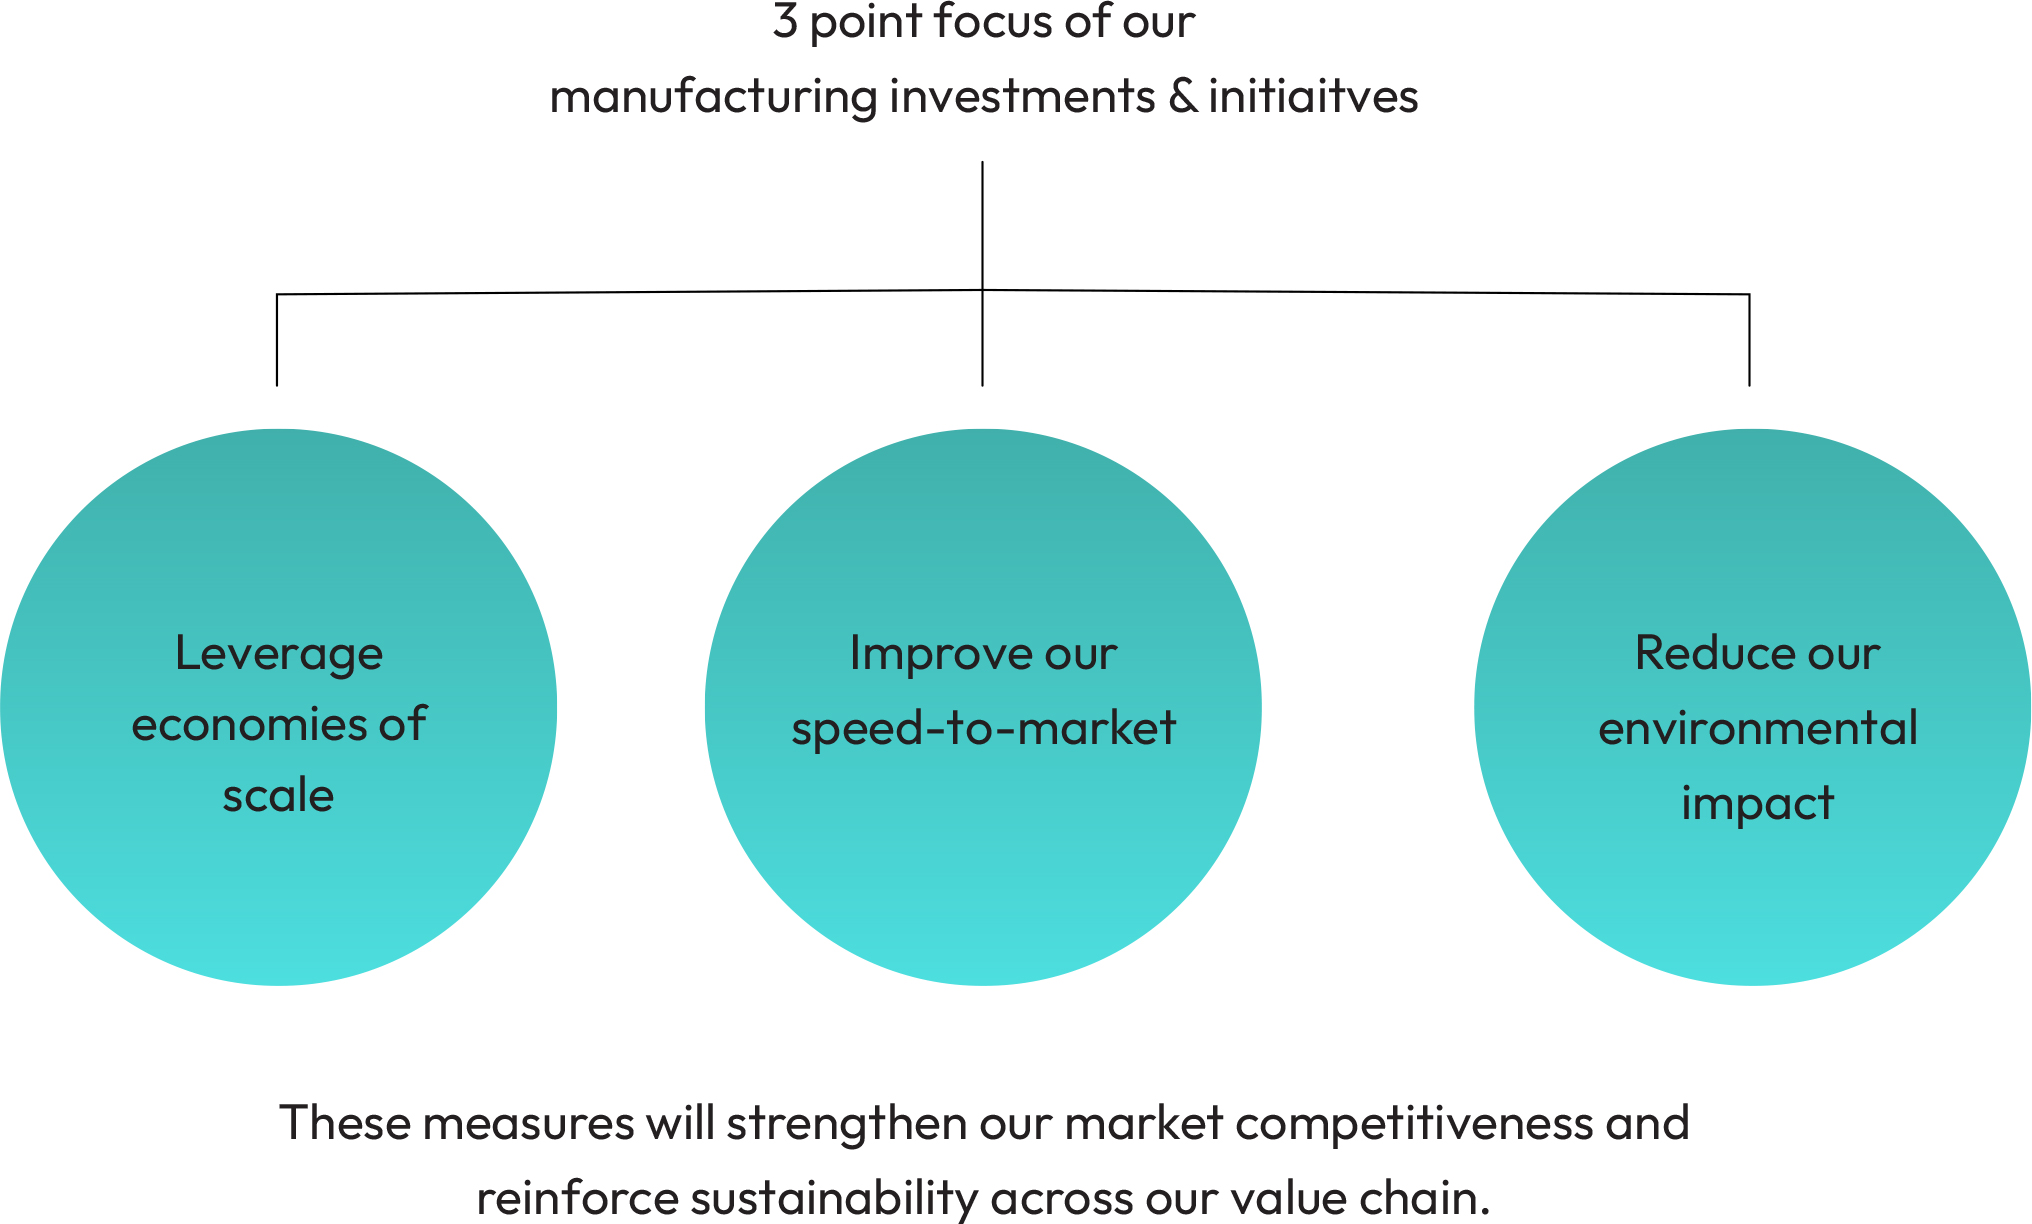
- Leveraging economies of scale
- Improve speed-to-market
- Reduce our environmental impact
Risks identified
- Inflation and currency devaluation
- Commodity price volatility
- Evolving Regulations
We have refined our product portfolio and innovation approach to focus on core
priorities. Our strategy leverages our manufacturing capabilities to emphasize
high-margin products while optimizing inventory management. At the same time,
we are enhancing operational efficiency through sustainable manufacturing
practices, Industry 4.0 technologies, and stringent quality management processes.
Streamlining product offerings and
enhancing process efficiencies
Innovation has always been central to our operations. We have redefined our approach to product development, concentrating on high-impact opportunities that deliver significant long-term value. Our refined innovation strategy emphasizes fewer but more impactful New Product Developments (NPDs) that drive substantial growth.
To strengthen our innovation capabilities, we have embraced key principles:
- ‘Less is More’ Approach: Focusing on fewer but more significant and superior innovations.
- Enhanced Consumer-Centricity: Incorporating deep consumer insights into decision-making processes.
- 100% Objectivity: Implementing a rigorous stage-gate process with structured governance.
- Global integration: Optimizing production synergies for global efficiency.
- Sustainability integration: Embedding sustainability into every aspect of the value chain.
Additionally, while new brand development remains crucial for long-term value creation, we
are strategically phasing out smaller brands where it aligns with our broader value realization
strategy.
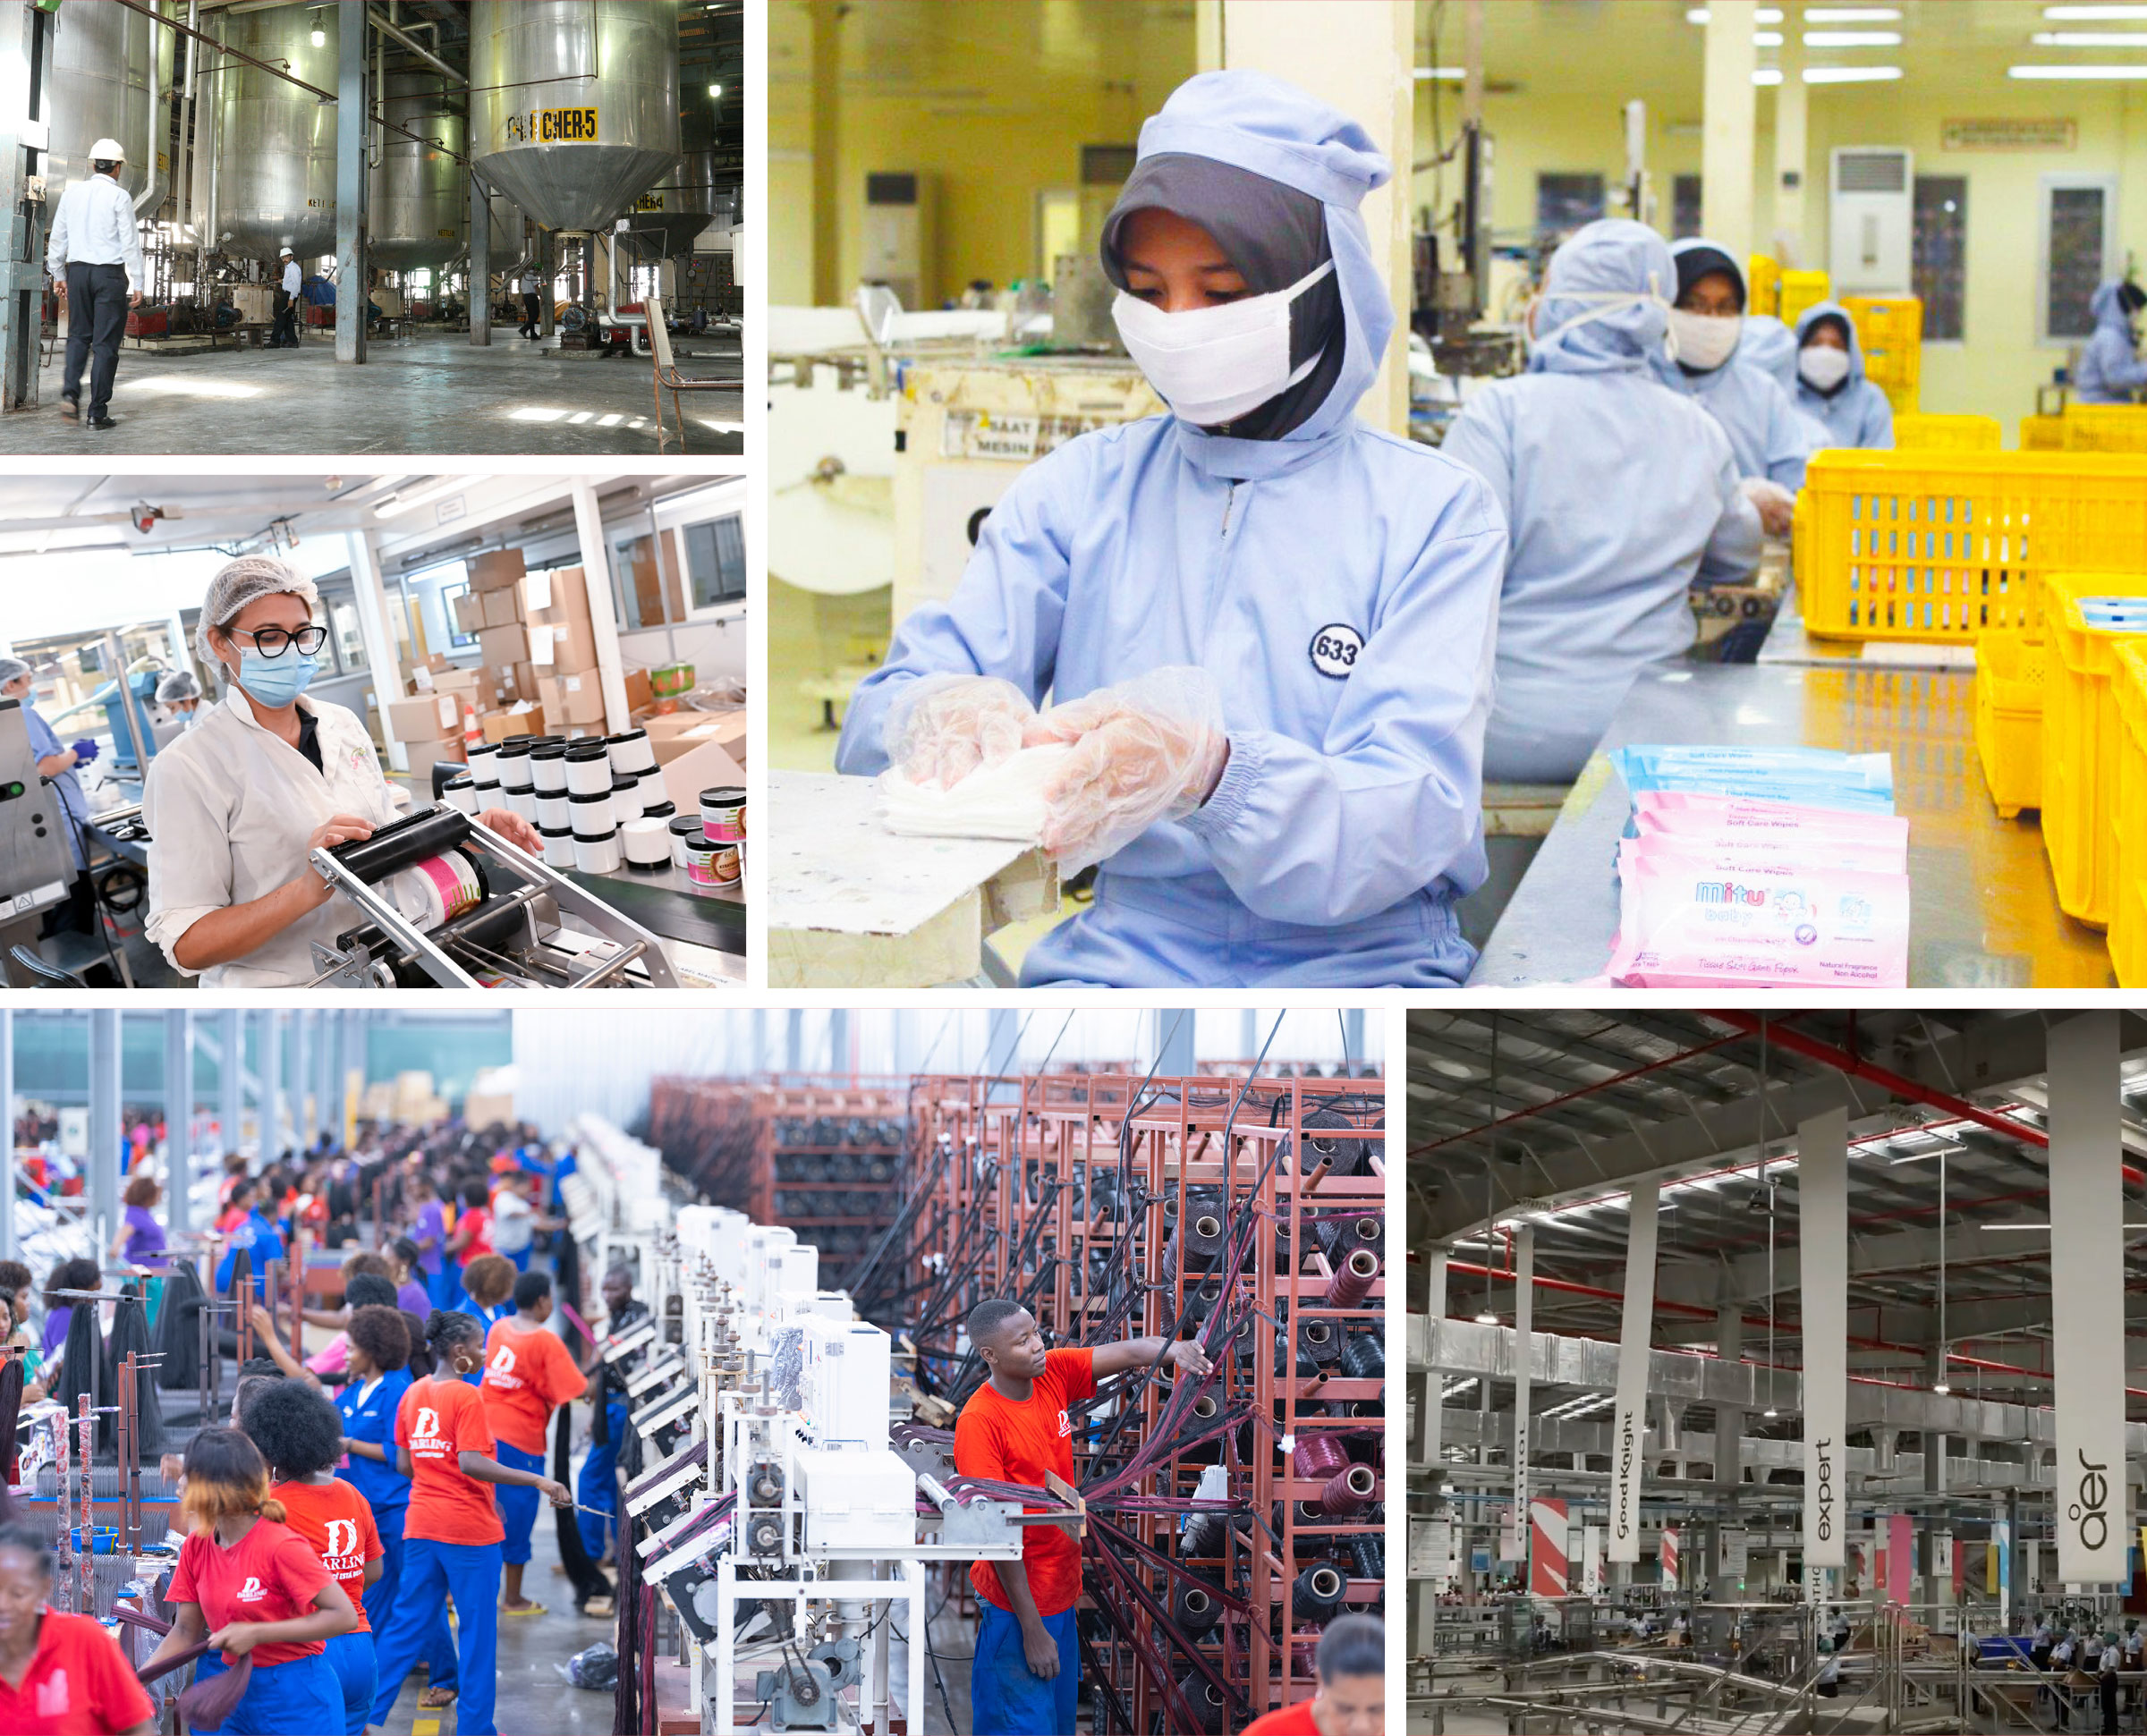
Factories across our locations in India, Africa,
Latin America, and Indonesia
Critical enablers
1. SKU rationalisation
Since 2022, we have focused on optimizing resources and improving operational efficiency through a Stock Keeping Unit (SKU) rationalization strategy, emphasizing high-performing products. This initiative has streamlined our portfolio, enhanced manufacturing efficiency and reduced waste.
In Indonesia, our Product Range Simplification initiative, has driven transformative results. We have reduced our SKUs by over 23% from 2022 and have significantly enhanced supply chain efficiency. This continued focus on simplification has yielded measurable gains. We have been able to reduce our inventory levels from 42 days in 2022 to 27 days in 2025 helping us eliminate slow-moving stock and provide stronger control across the supply chain.
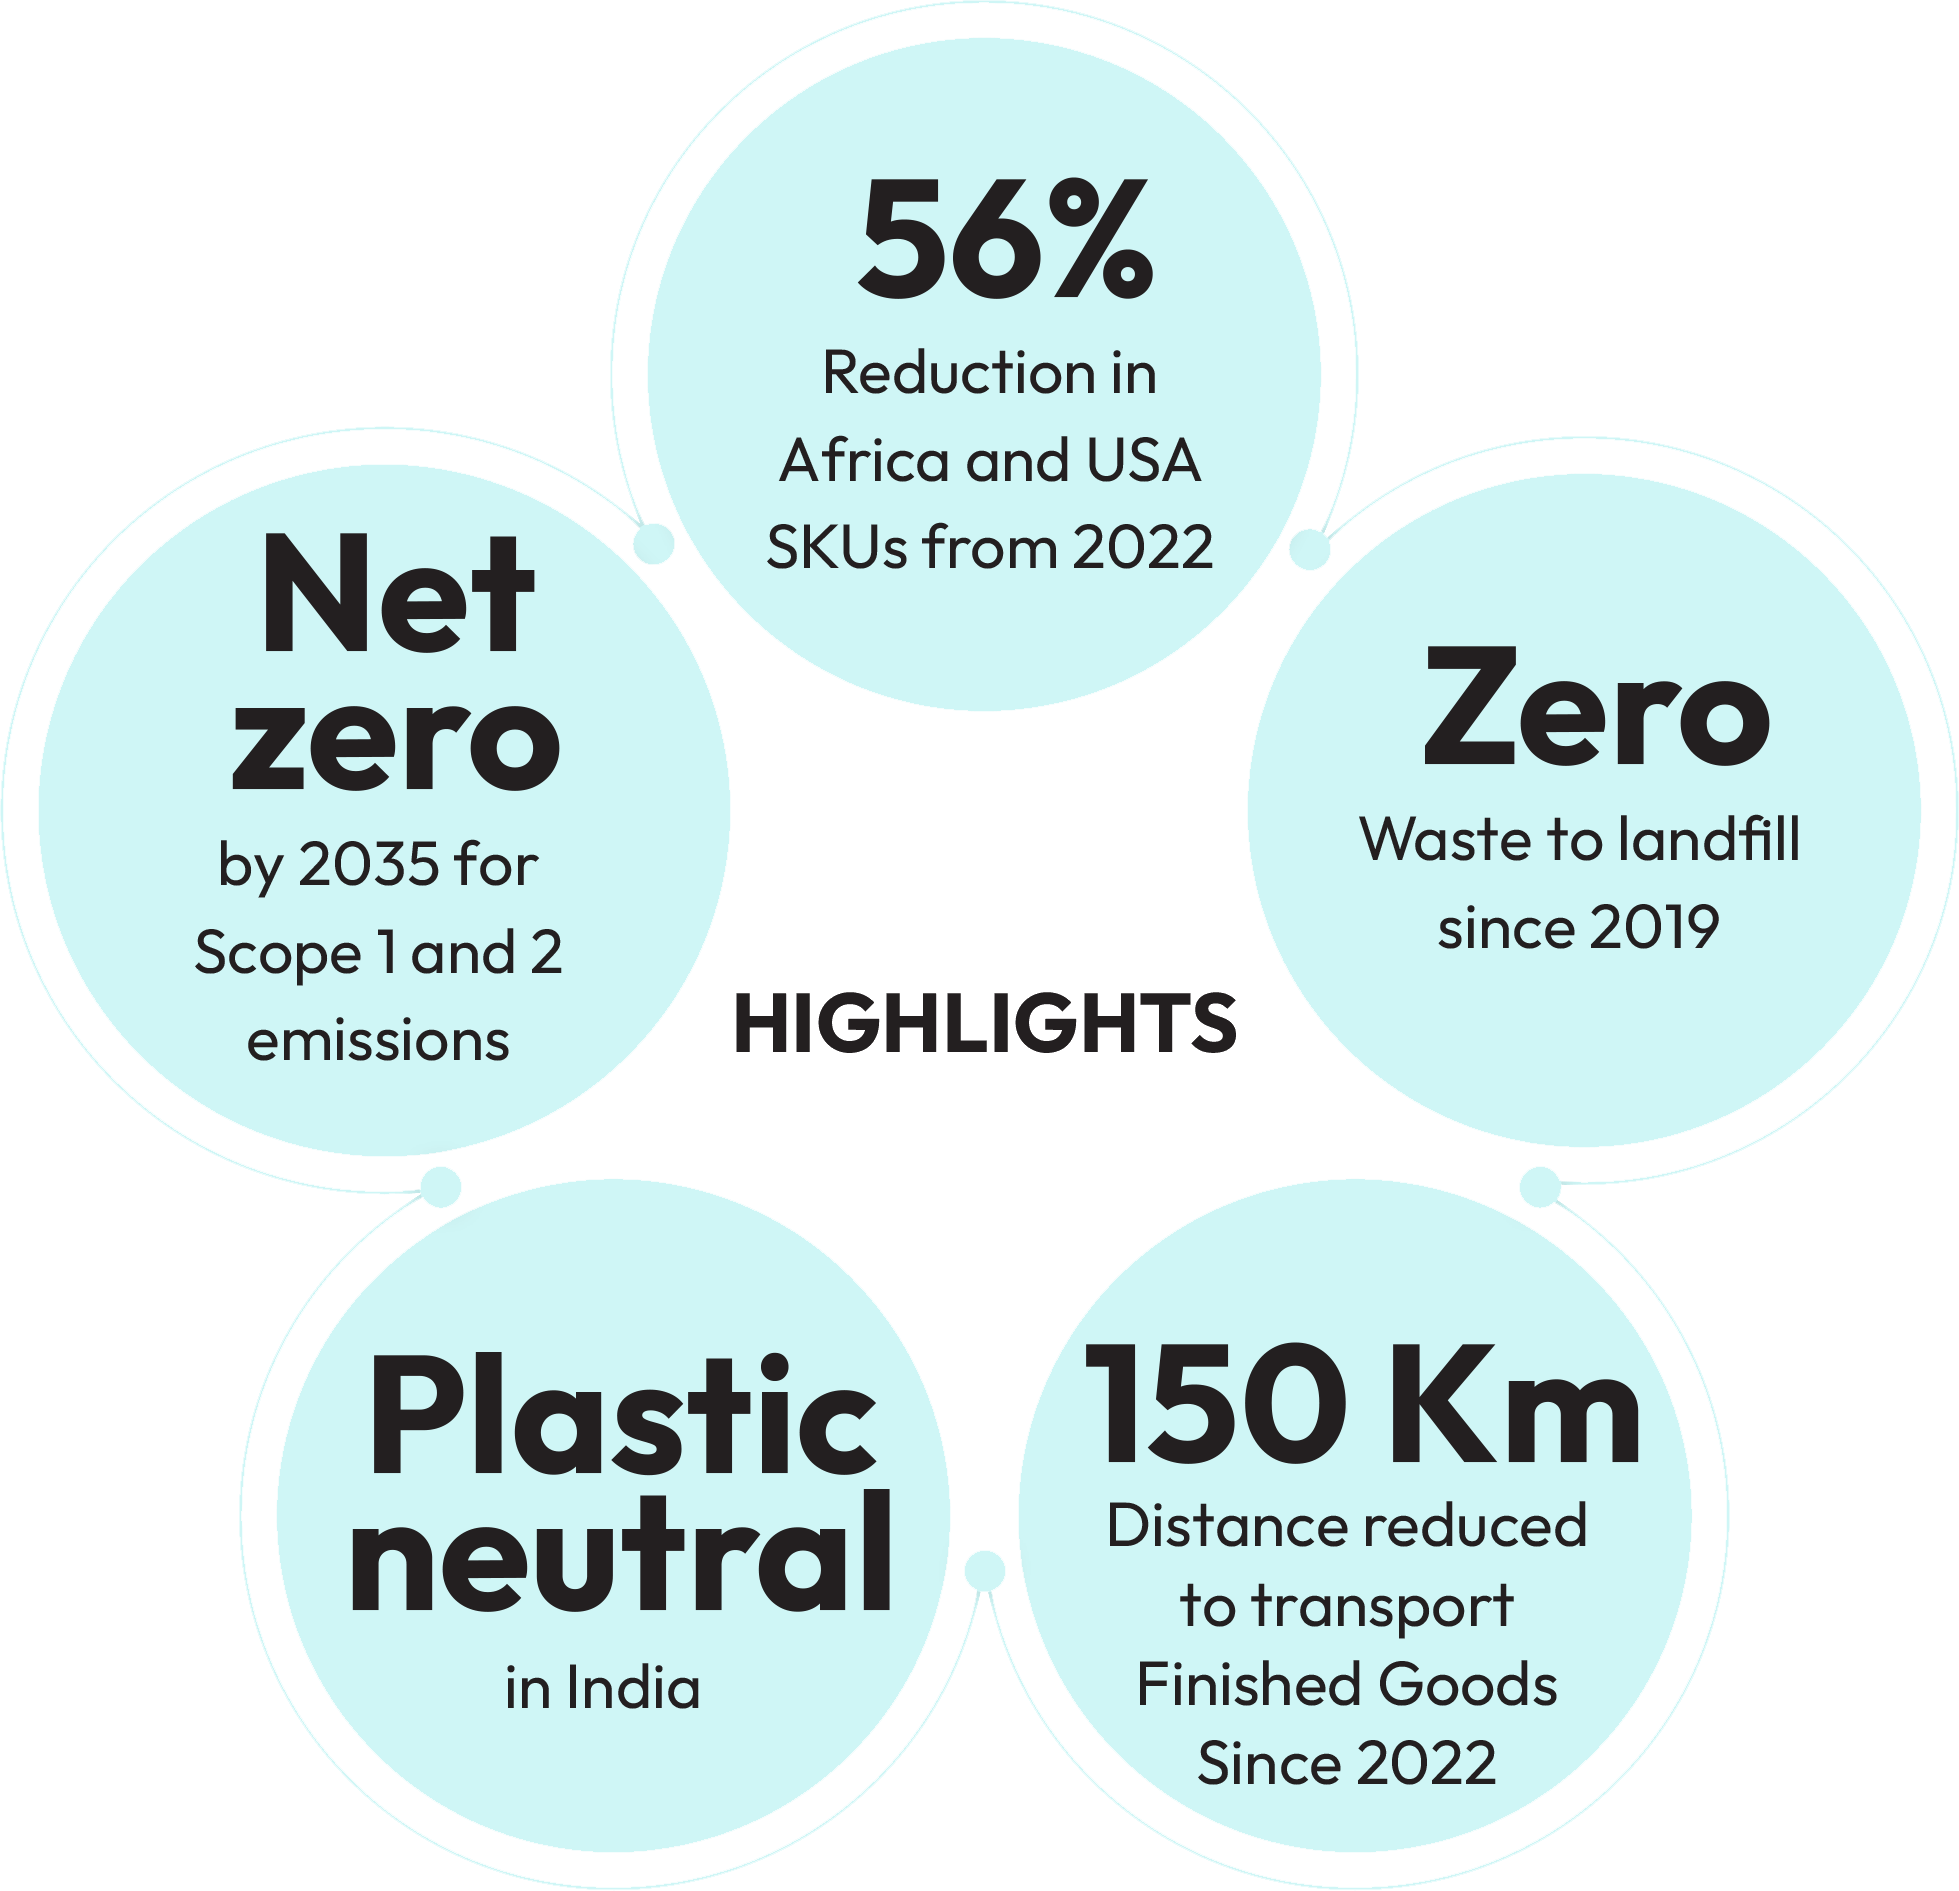
In our GAUM (Africa and USA) operations, we have reduced our SKUs by over 56% from 2022. SKU rationalization has aligned our inventory with actual demand, reduced excess stock and mitigated overstocking risks. Additionally, it has improved our demand forecasting accuracy and refined planning processes to better anticipate customer needs.
We continue with this approach that has enabled us to have a more agile and responsive approach to changing market dynamics.
2. Inventory optimisation
As part of our ongoing efforts to enhance operational efficiency, we have significantly reduced inventory days across all our geographies. This strategic move strengthens working capital management, enabling us to better adapt to market fluctuations and align our supply chain with consumer demand. To support this, we have implemented various digital initiatives across manufacturing and supply chain operations.
We have adopted a Transportation Management System that, has helped us optimize transportation routes and loads, reducing freight costs. We have reduced the distance travelled for our finished goods
from our plants to our CFAs by 150 kms since 2022. This has saved costs, lowered fuel consumption and in turn helped reduce our emissions.
We have adopted a Transportation Management System that, has helped us optimize transportation routes and loads, reducing freight costs. We have reduced the distance travelled for our finished goods from our plants to our CFAs by 150 kms since 2022. This has saved costs, lowered fuel consumption and in turn helped reduce our emissions.
Additionally, we have automated scheduling and planning processes, facilitating seamless supply chain operations, faster decision-making, and overall enhanced efficiency. We have also made significant progress in key initiatives, such as designing a future network layout for our distribution system and implementing replenishment-driven sales strategies for our distributors.
We continue to enhance demand forecasting through advanced analytics and historical sales data, enabling more precise predictions, proactive inventory adjustments, and reduce stock-outs or surplus stock. We are committed to our approach of inventory optimization and continue to explore and implement innovative strategies to drive efficiency, reduce costs, and enhance customer satisfaction worldwide.
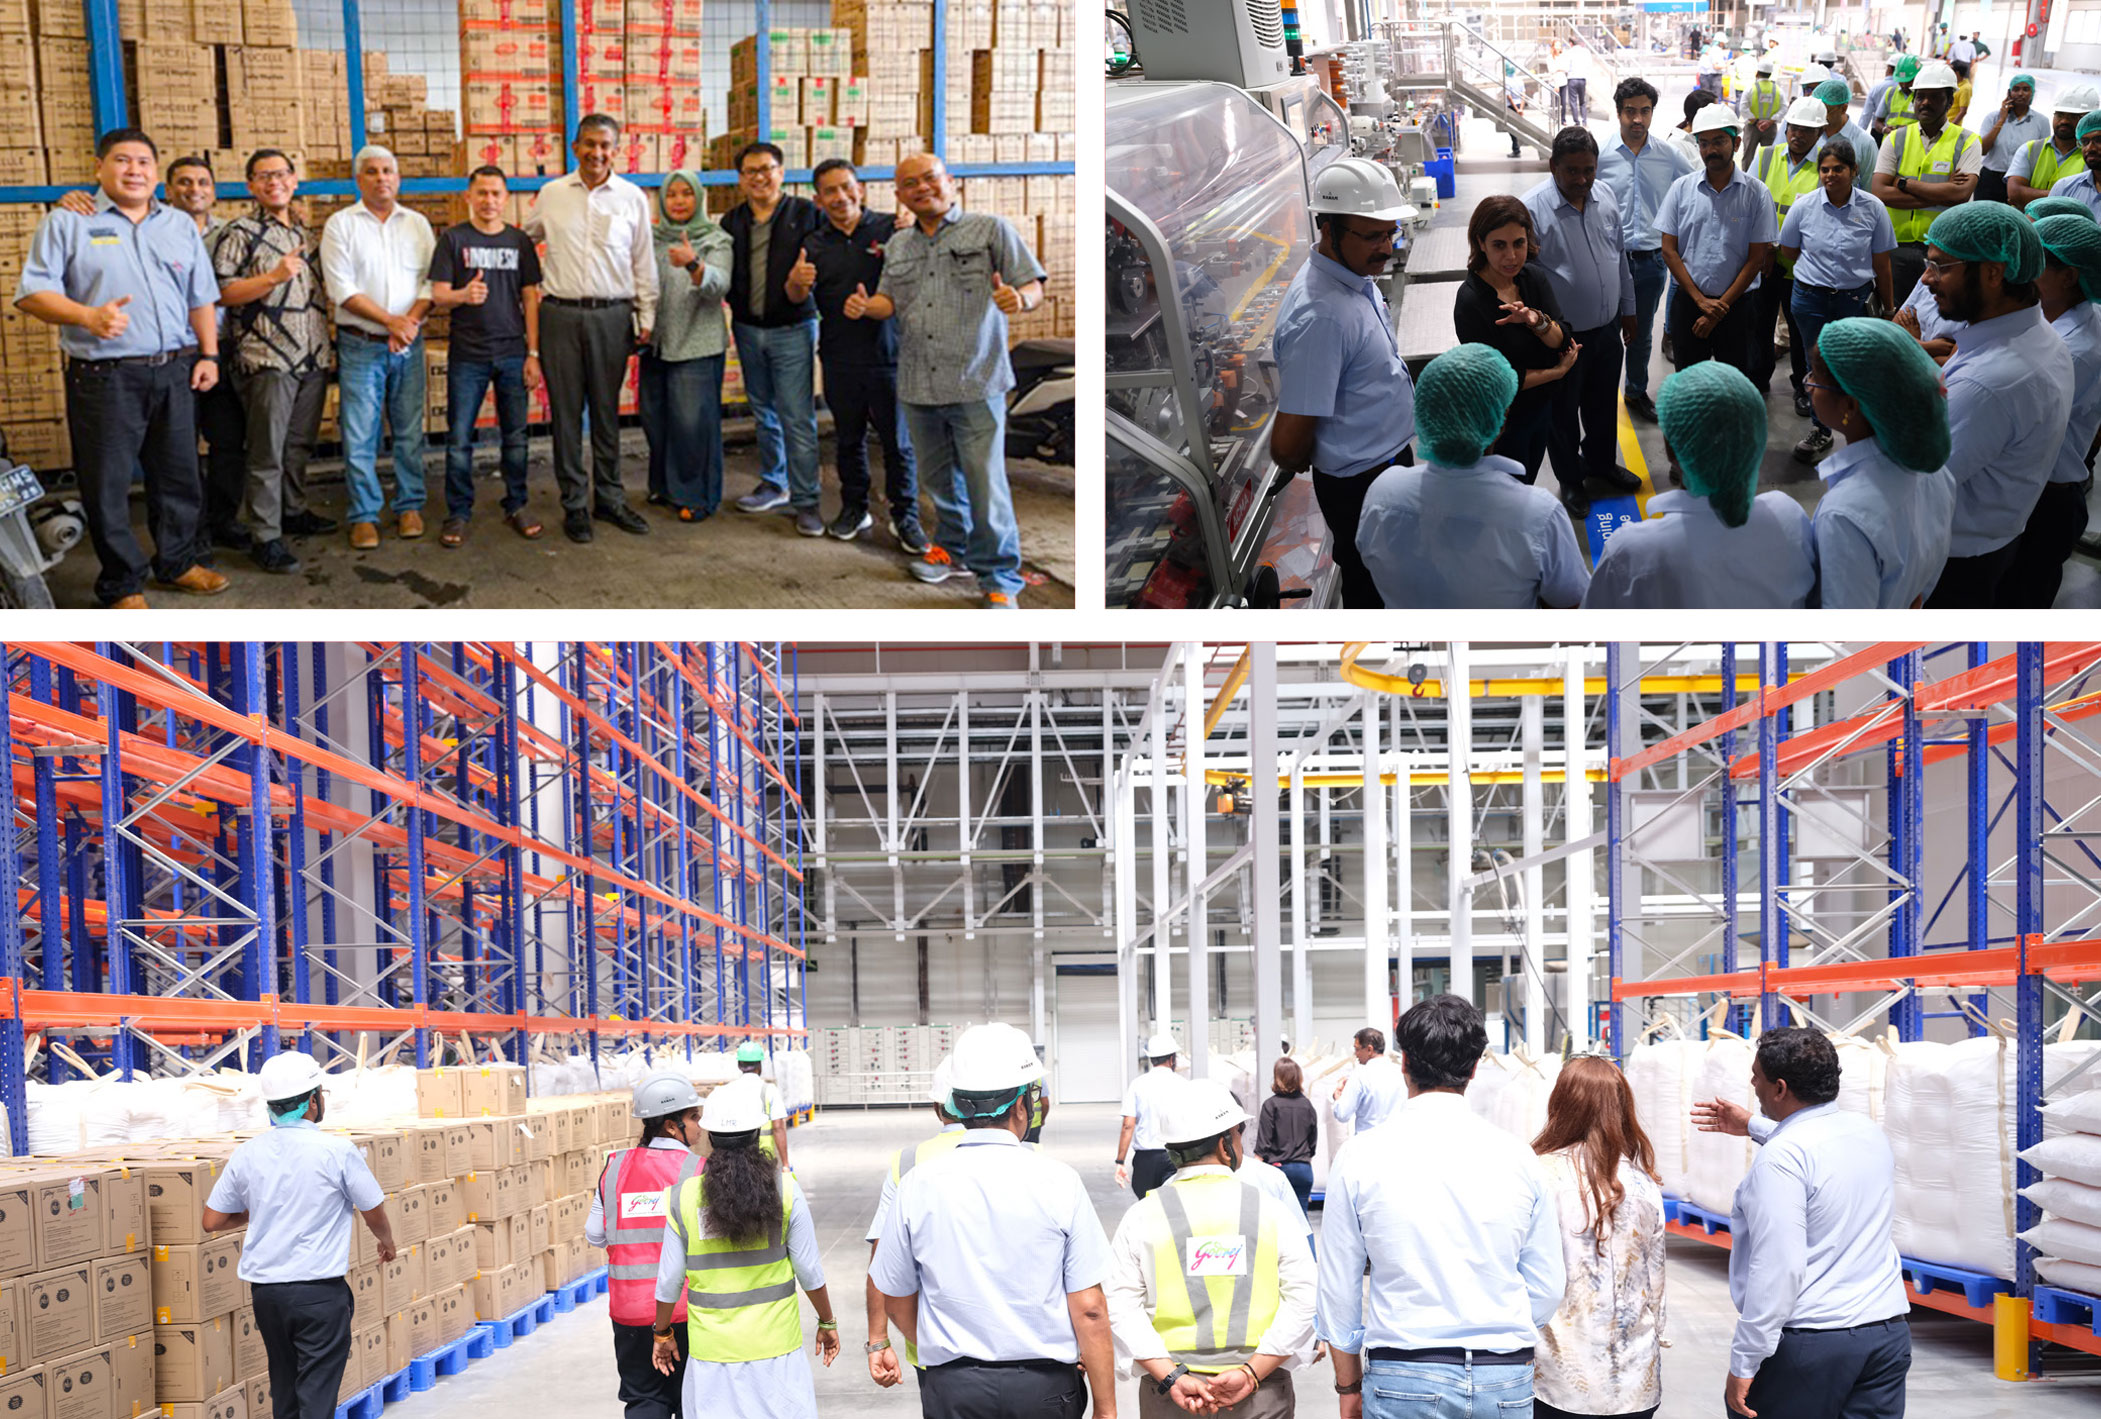
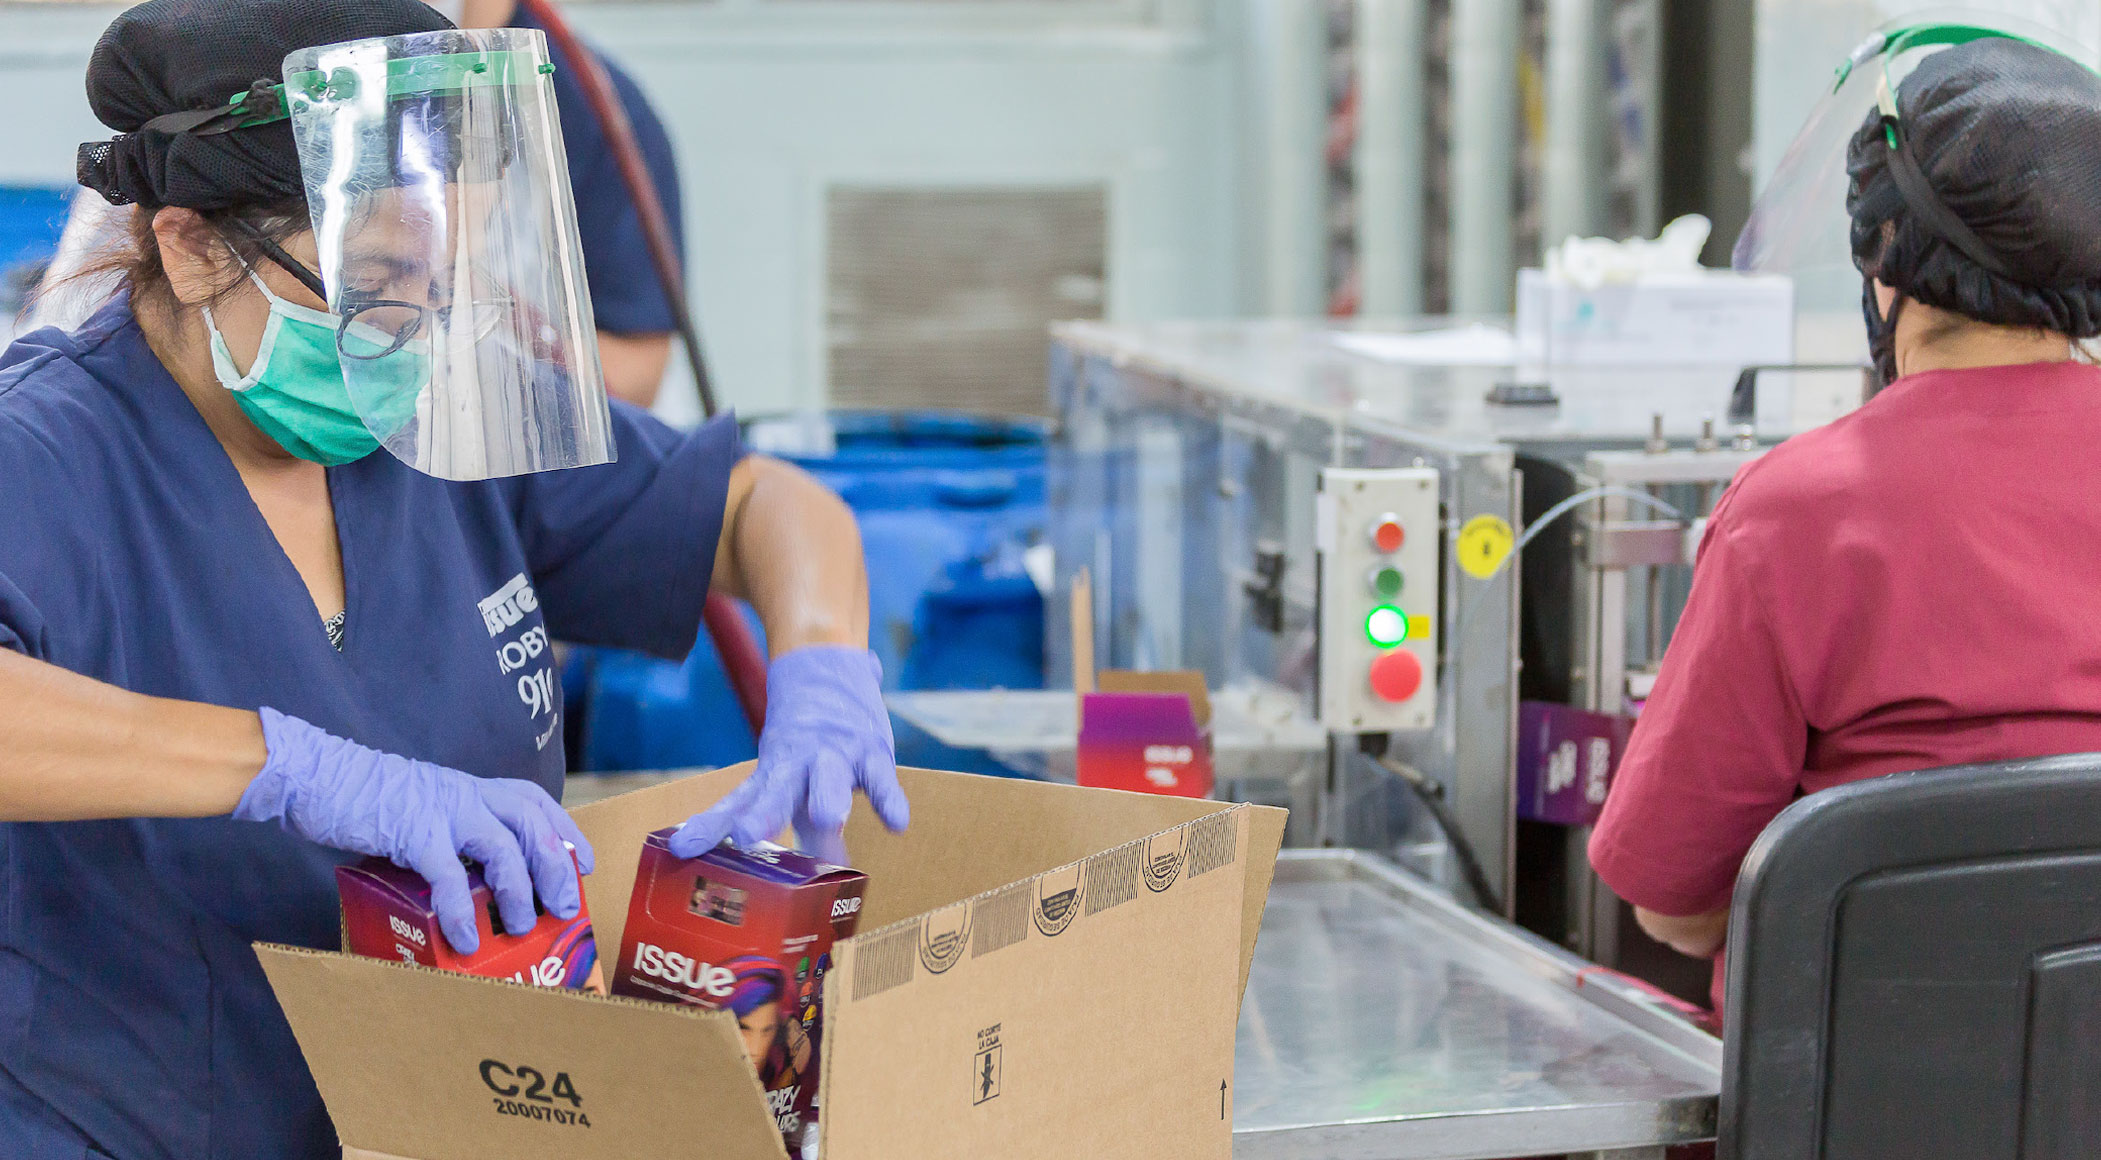
Engaging with shopfloor employees
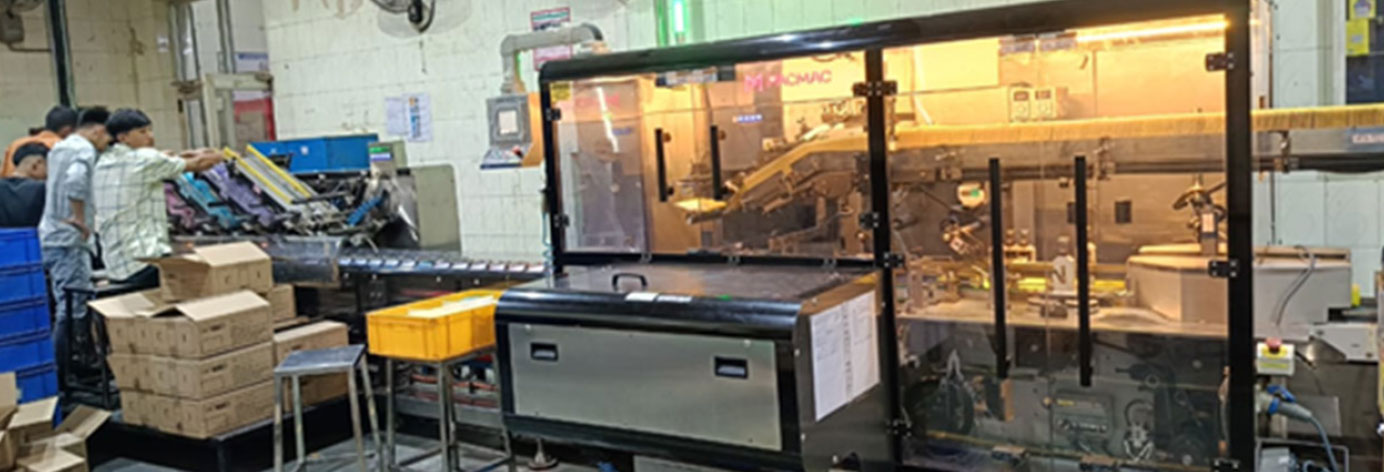
3. Industry 4.0
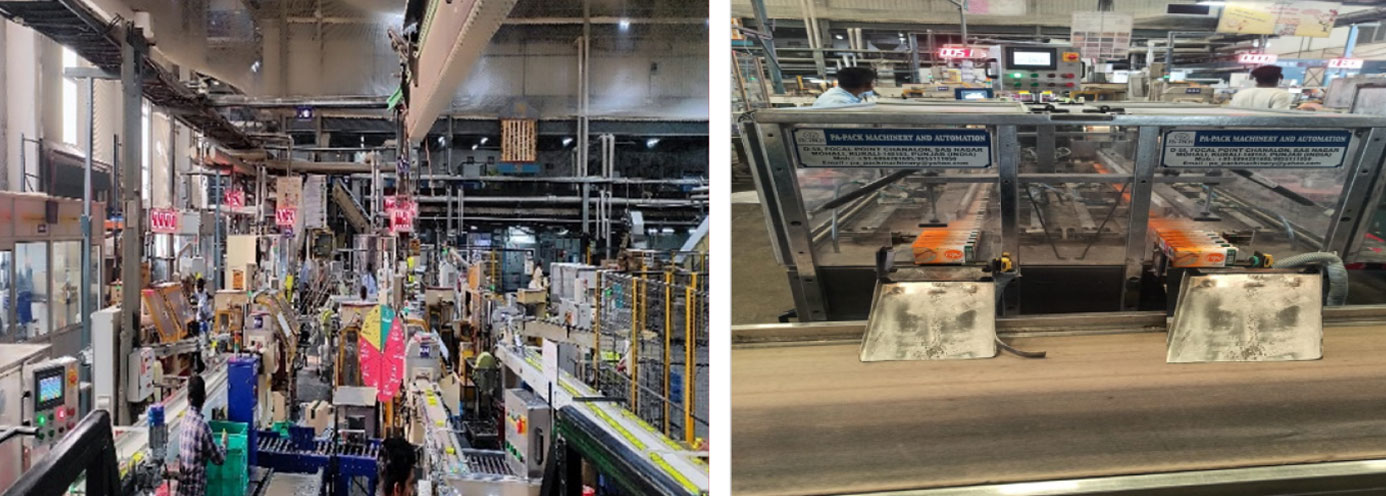
We have strategically invested in advanced automation technologies and IT systems to enhance manufacturing efficiency, reduce manual intervention, and optimize operational performance.
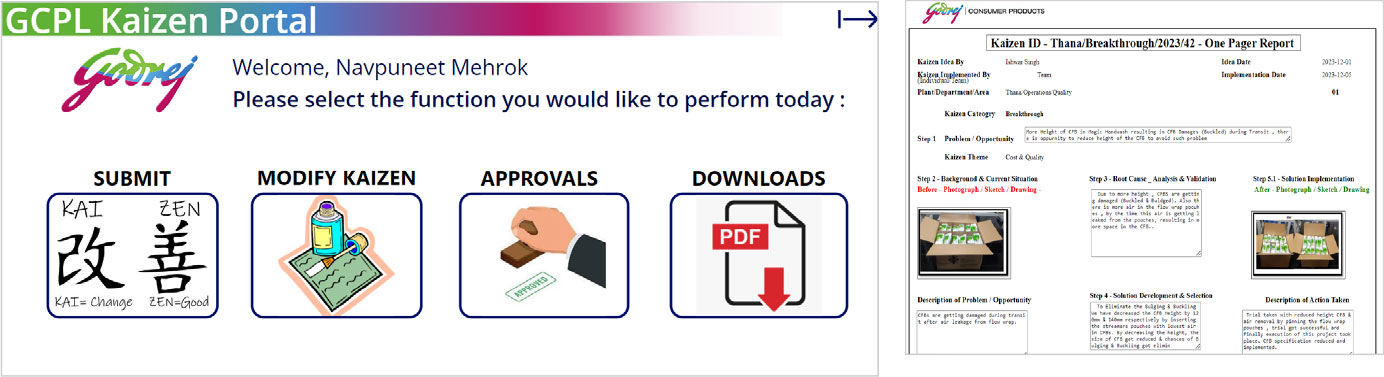
In the North Cluster, we have made notable strides in automation and Industrial IoT (IIoT) integration to enhance operational efficiency, product quality, and cross-functional knowledge sharing. One of the key initiatives was the launch of the Kaizen Portal, designed to centralize and streamline
continuous improvement practices across all factories. This digital platform enables stakeholders from every location to access a shared knowledge base for faster horizontal deployment of successful practices. We have introduced an authentication system to improve the quality and reliability of Kaizen submissions. Additionally, the portal’s dashboard feature helps teams to revisit historical data that is particularly useful for onboarding new employees and fostering a culture of learning.
In the North Cluster, we have made notable strides in automation and Industrial IoT (IIoT) integration to enhance operational efficiency, product quality, and cross-functional knowledge sharing. One of the key initiatives was the launch of the Kaizen Portal, designed to centralize and streamline continuous improvement practices across all factories. This digital platform enables stakeholders from every location to access a shared knowledge base for faster horizontal deployment of successful practices. We have introduced an authentication system to improve the quality and reliability of Kaizen submissions. Additionally, the portal’s dashboard feature helps teams to revisit historical data that is particularly useful for onboarding new employees and fostering a culture of learning.
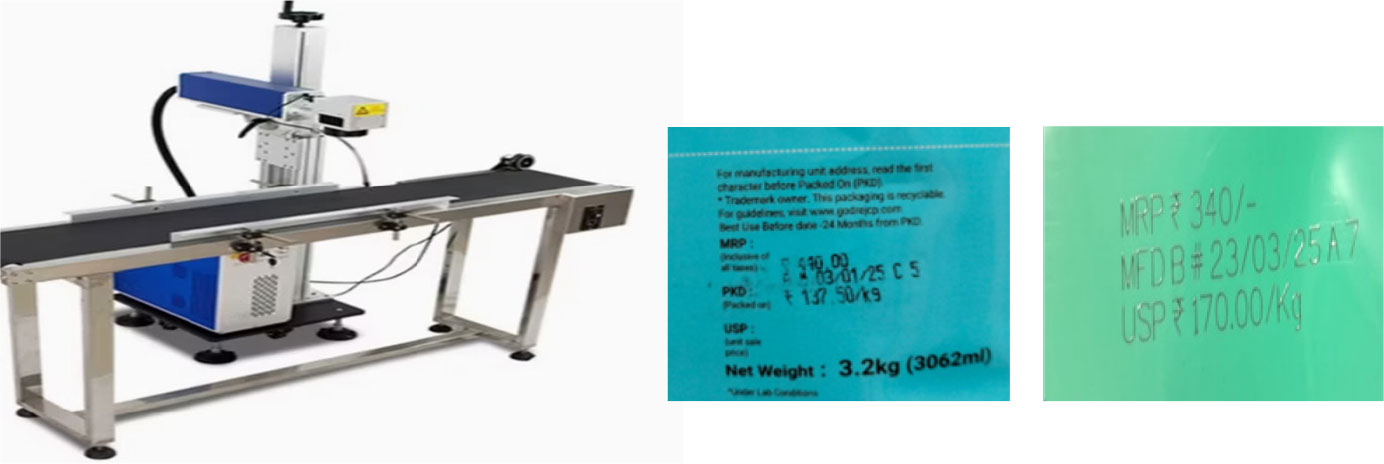
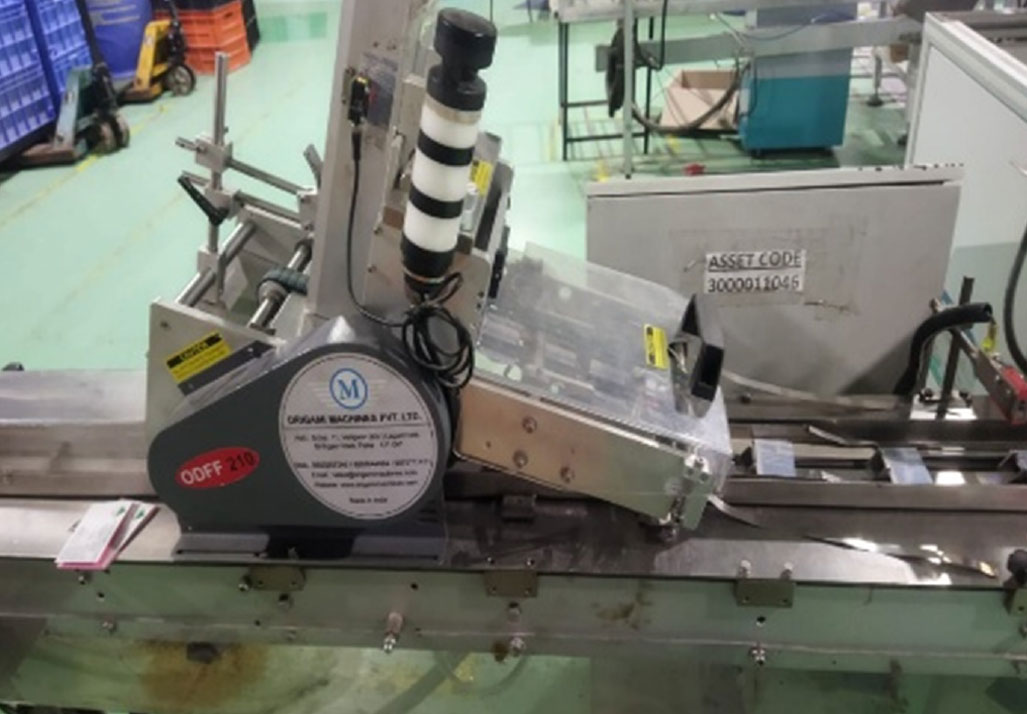
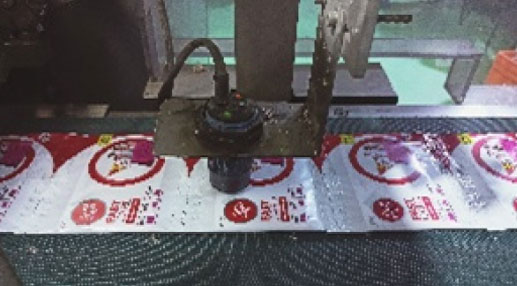
To address recurring quality concerns at the Ezee plant, we installed a laser printer for pouch packaging. This move has significantly improved the clarity and permanence of product labelling. We have been able to eliminate smudged or erased printing issues that were frequent sources of customer complaints and, we have enhanced overall product presentation and customer satisfaction.
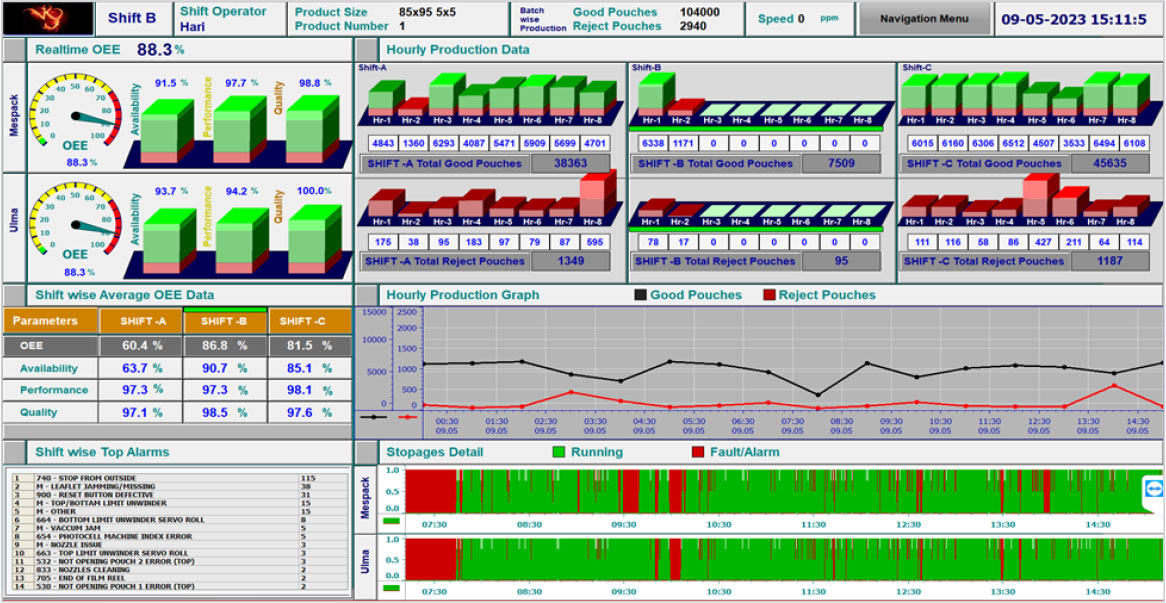
Further advancing our digital capabilities, we implemented an IoT-enabled dashboard on the Mespac line. This system provides real-time visibility into key production metrics, including live Overall Equipment Effectiveness (OEE) and hourly production trends. The dashboard also automates the logging of breakdowns, reducing manual effort and enabling better analysis. By identifying the nature of major breakdowns in real-time, teams are now able to respond to root causes more effectively, rather than spending valuable time on broader troubleshooting.
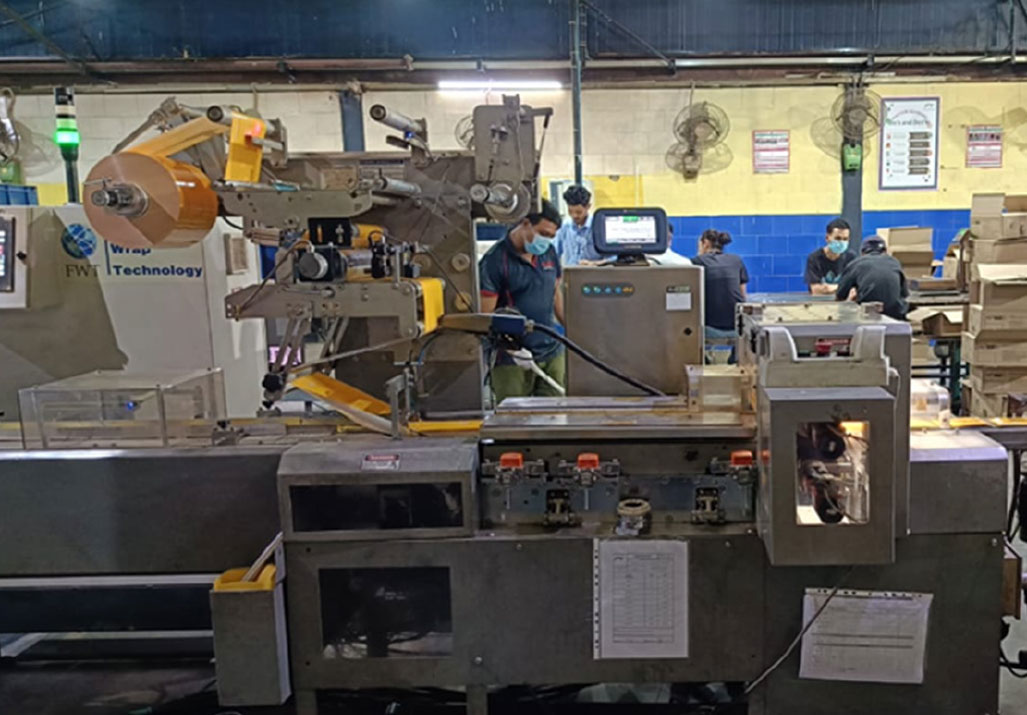
At our Kathua plant, the installation of the 5th wrapping line and double track banding system has yielded substantial performance improvements. These upgrades have driven a 6% increase in productivity across both lines and a 10% reduction in breakdown
occurrences. Additionally, this operational enhancement contributed to a substantial GST refund benefit, showcasing the financial and compliance advantages of targeted automation investments.
At our Kathua plant, the installation of the 5th wrapping line and double track banding system has yielded substantial performance improvements. These upgrades have driven a 6% increase in productivity across both lines and a 10% reduction in breakdown occurrences. Additionally, this operational enhancement contributed to a substantial GST refund benefit, showcasing the financial and compliance advantages of targeted automation investments.
In the South Cluster, we accelerated our digital and automation journey by implementing a series of smart manufacturing and Industry 4.0 initiatives, significantly improving operational efficiency, accuracy, and manpower productivity across units in FY 2024-25.
As part of automation upgrades, we installed an auto-counting machine for incense sticks and an automated pouch packing machine, both of which streamlined the production process and reduced manual handling. In Coil Units 6 and 7, we introduced automated cartoning machines that has led to a measurable reduction of four man-days per shift per unit, enhancing productivity while optimising workforce deployment. Additionally, we commissioned a two-track Aer Pocket line featuring a high-speed 100 UPM flow wrap machine and integrated a Coil flow wrapper system using 50-micron post-consumer recycled (PCR) film, in line with our sustainability commitments. To further enhance traceability and compliance, a laser printer was installed for batch printing on refill labels, ensuring precision and consistency in packaging.
On the digital front, the South Cluster implemented a range of Industry 4.0 solutions, spearheading our transition towards data-driven manufacturing. At the Pondicherry Conso refill line, IoT sensors were deployed to monitor key production metrics including counts, runtime, downtime, quality loss, and performance.
A dedicated dashboard enables real-time visibility, empowering teams to make proactive operational decisions.
We digitised safety protocols with the rollout of an online Safety Work Permit System across most of our South Cluster units, ensuring complete traceability and easy retrieval of records. To enhance measurement precision and streamline quality checks, an Auto Fill Volume Check application was introduced, enabling more accurate and time-efficient auto weighment processes. In parallel, we launched a fully automated due date reminder system, developed in-house using Microsoft Power Automate. It tracks critical calibration, validation, WS, and legal updates. This zero-cost solution eliminates the need for manual tracking while ensuring all stakeholders are timely informed.
A notable step towards paperless operations was the launch of a Visual In-Process Inspection tool built using Microsoft Power Apps and Automate. This digital solution eliminates hard-copy inspection reports, offering real-time visibility and traceability of in-process quality checks.
Furthermore, we developed a DSS+ Safety Inspection Round Observation app, integrated with Power BI and Automate, to generate observation reports automatically. These reports are promptly shared with regional leadership, safety leads, and coordinators, enhancing efficiency and accountability in safety management, again with zero additional cost.
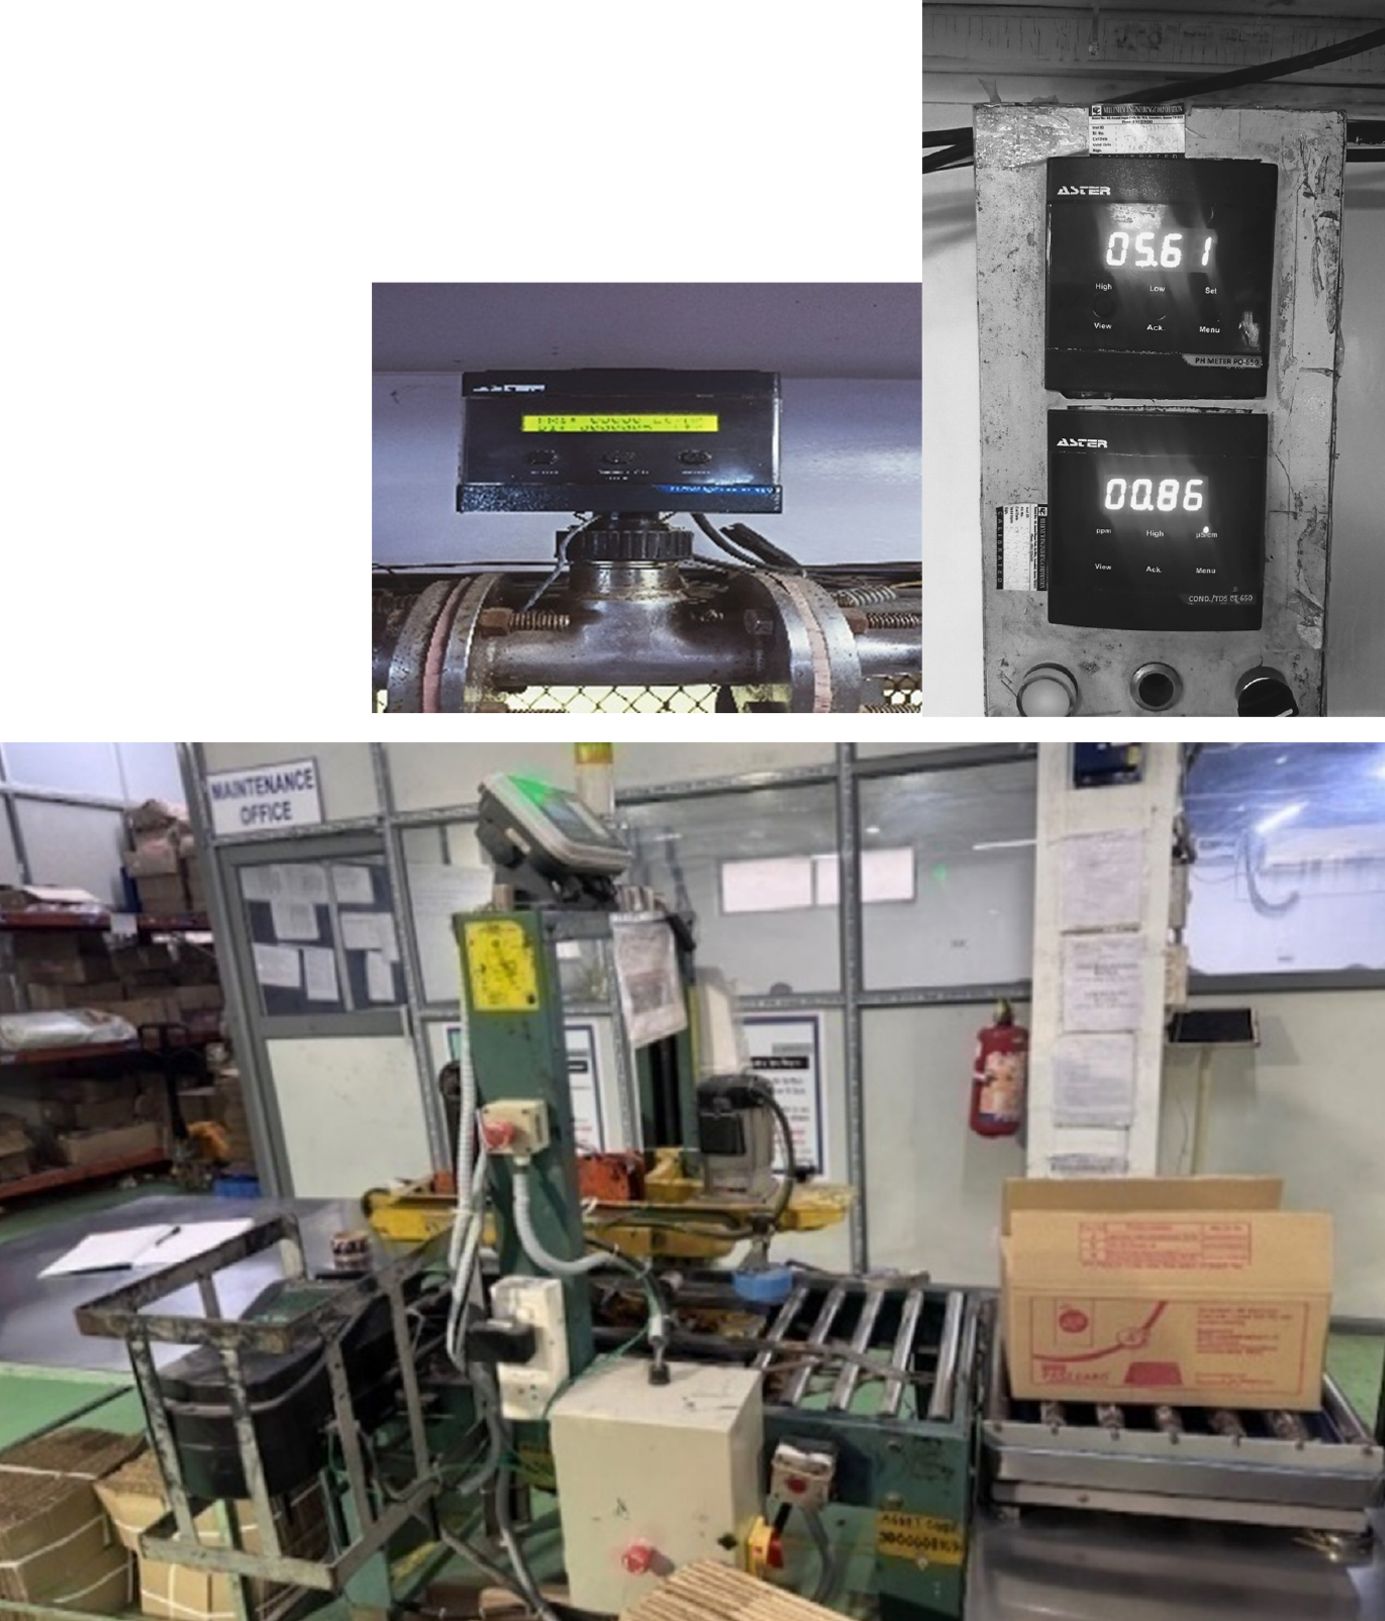
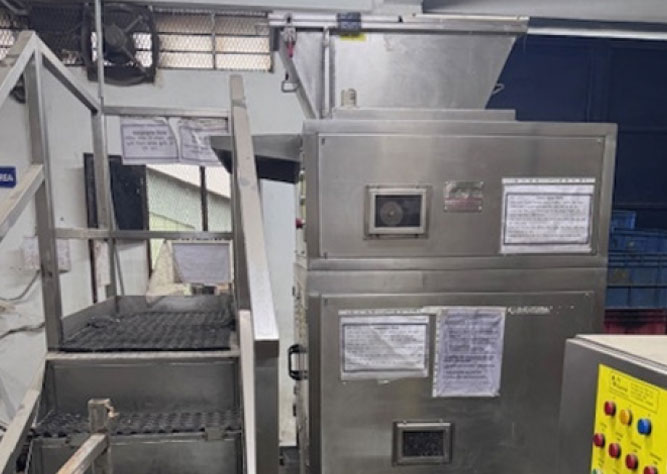
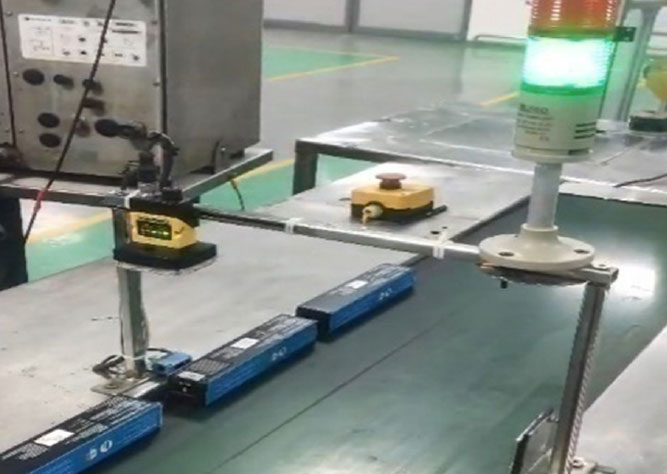
In the Northeast (NE) Cluster, we successfully implemented a wide range of digitalisation and Industrial IoT (IIoT) automation initiatives, led by the regional team. These advancements significantly enhanced operational efficiency, energy optimisation, process reliability, and product quality. A key improvement was the implementation of an Automated Weighing and Printing System for CFBs, which enabled accurate product weighing, helping eliminate shortage-related complaints in the market. Additionally, the automated generation of quality reports (Certificate of Analysis) from SAP has facilitated secure, on-demand data retrieval while reducing paper usage. In the production process, we installed an Automated Water Transfer System to ensure precise dosing of demineralised water per batch, improving resource utilisation.
IoT implementation at our
manufacturing facilities
Auto Weight & Print System
Similarly, the Automated Nitrogen Pressure Control System introduced in our GERC lines ensures adherence to process parameters and helps prevent product contamination.
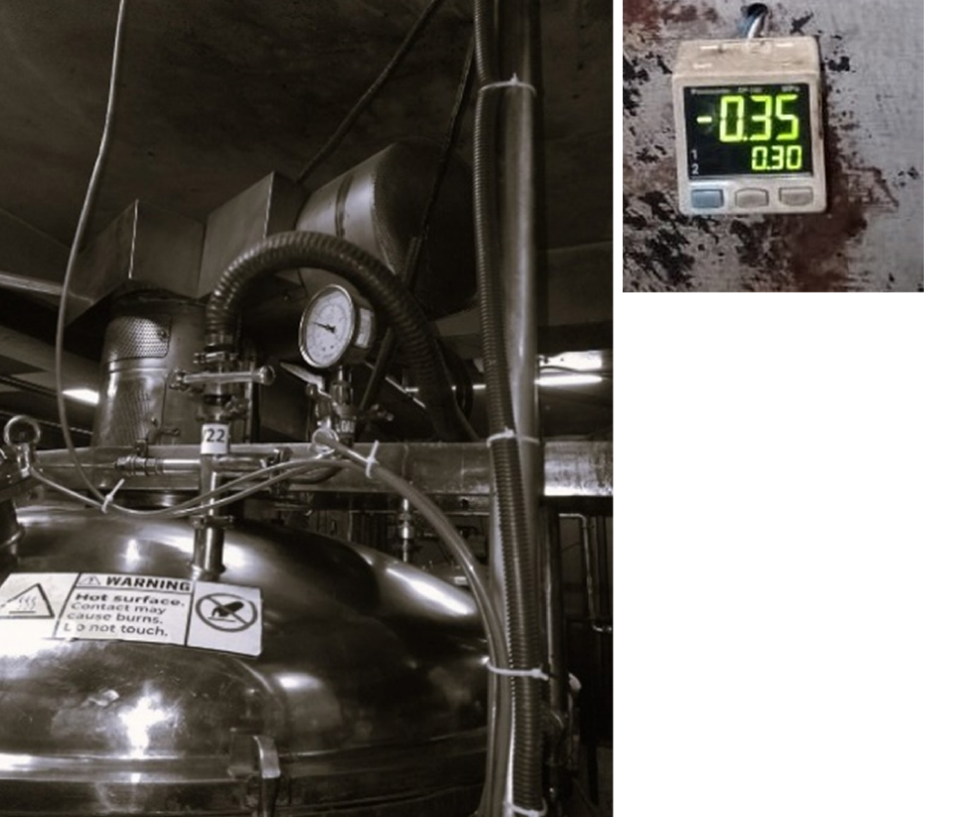
Auto Nitrogen Pressure
Controller
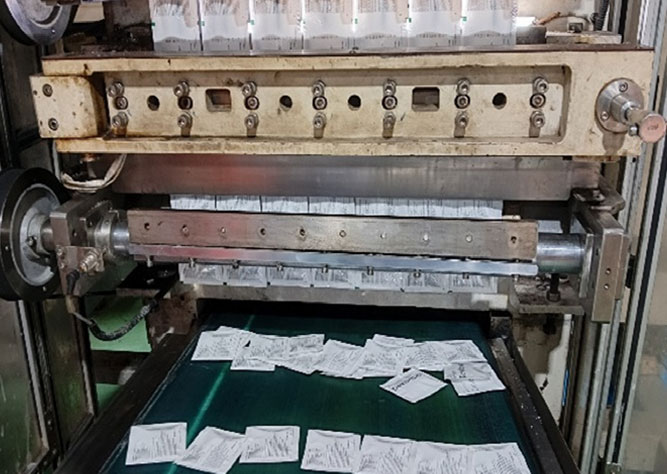
To address process inefficiencies and enhance machine productivity, Auto Leaflet Feeders were deployed across our GERC and Fast Card flow wrap lines, eliminating breakdowns caused by manual feeding. An Automatic Leaflet Detection System was also introduced in final products to strengthen quality assurance.
Auto Leflet Feeder
Auto Leaflet Detection System
The Digital Monitoring System implemented in GERC lines now provides real-time, remote access to downtime data enabling immediate visibility into line performance and ensuring timely decision-making. The Online Checkweigher system in GERC and Aer Pocket lines has improved compliance by eliminating manual weight checks and reducing human error. To further support statutory compliance and maintain labelling integrity, an Automated Print/No Print Detection and Ejection System was added to the Godrej Professional line.
Auto High Speed Flow Wrap Machine
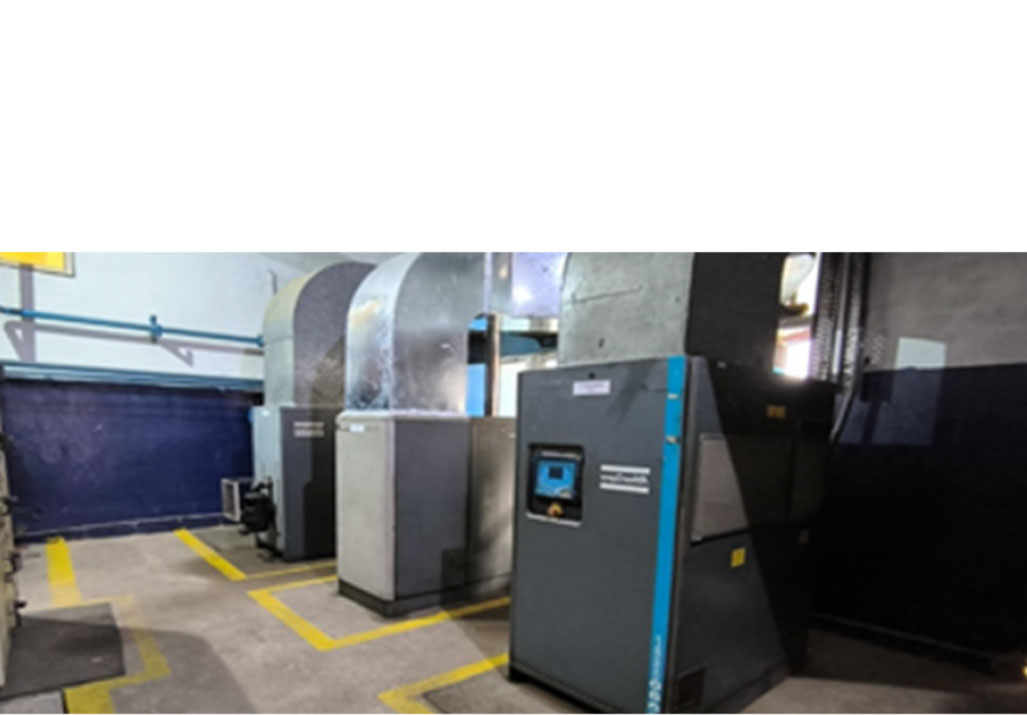
Advance Auto Energy Efficient Compressor
We also introduced a Multi-Track Automated Machine, that has greatly enhanced production speed and efficiency. In Aer Pocket, a new Automated Assorted Machine eliminated the need for manual processes, improving productivity and enabling manpower savings of 22 individuals. Similarly, the Auto Pouch Cut and Squeezing Machine deployed in Ezee operations accelerated recovery processes, enhanced
We also introduced a Multi-Track Automated Machine, that has greatly enhanced production speed and efficiency. In Aer Pocket, a new Automated Assorted Machine eliminated the need for manual processes, improving productivity and enabling manpower savings of 22 individuals. Similarly, the Auto Pouch Cut and Squeezing Machine deployed in Ezee operations accelerated recovery processes, enhanced safety, and reduced manual intervention, saving an additional five workers. To synchronise with the multitrack machines, an Automatic Rotary Cutter was installed, improving machine speed and output quality. Lastly, in our ARG lines, Auto Online Printing replaced manual printing on offline conveyors, reducing manual labour and increasing production speed.
safety, and reduced manual intervention, saving an additional five workers. To synchronise with the multitrack machines, an Automatic Rotary Cutter was installed, improving machine speed and output quality. Lastly, in our ARG lines, Auto Online Printing replaced manual printing on offline conveyors, reducing manual labour and increasing production speed.
Automatic Assorted Pack Machine
Auto Pouch Cut & Squeez MC
Auto Rotary Cutter
Auto Print Check & Ejection
System
In the Central West (CW) Cluster, we implemented an Automated Reporting System (ARS) for Chemical Plant 3 and the new Continuous Saponification Plant (CSP), ensuring the timely distribution of daily reports via email to relevant stakeholders for improved process visibility and decision-making. The cluster deals with large number of process equipment and instruments for which timely calibration is essential
In the Central West (CW) Cluster, we implemented an Automated Reporting System (ARS) for Chemical Plant 3 and the new Continuous Saponification Plant (CSP), ensuring the timely distribution of daily reports via email to relevant stakeholders for improved process visibility and decision-making. The cluster deals with large number of process equipment and instruments for which timely calibration is essential for accurate process control. To facilitate the real-time tracking of the calibration schedule, an Automated Instrument Calibration Notification System has been introduced that proactively alerts concerned teams about upcoming calibration due dates, improving compliance and instrument health and reducing potential breakdowns, serving as a cost-effective SAP alternative.
for accurate process control. To facilitate the real-time tracking of the calibration schedule, an Automated Instrument Calibration Notification System has been introduced that proactively alerts concerned teams about upcoming calibration due dates, improving compliance and instrument health and reducing potential breakdowns, serving as a cost-effective SAP alternative.
We have also automated Light and AC control in office spaces in the purpose of optimizing electricity load by eliminating manual intervention once anyone leaves the office. One of the energy-intensive activity of the Malanpur plant is the Raw Oil (RO) Heating and Auto-Heating System for RO Tanks, which now efficiently controls steam flow based on temperature control, resulting in the prevention of overheating of oil or excess steam consumption. In the area of process automation, the Auto Control of Mixer Level using radar level transmitters has eliminated operator dependency, conserving energy and improving equipment efficiency.
We have also implemented an Automated Rejection System on Soap Line-5, which identifies and rejects improperly aligned bands, reverse banding and thus improving the final product quality. In CSP-2, we synchronized the Caustic Feed Pump with the service tank's level transmitter, reducing its runtime by 80%. Similarly, the Condensate Water Feed Pump was synchronized using a similar logic.
We installed Weighing Checker Machines on lines 3 and 4, enabling accurate CFB weight printing, ensuring quality compliance before products are deployed to the market. These initiatives underscore our commitment to innovation, energy optimization, and operational excellence through smart, cost-effective in-house solutions.
4. Sustainable manufacturing
We are dedicated to optimizing manufacturing processes, reducing waste, and adopting energy-efficient technologies to minimize our environmental footprint. These initiatives contribute to a sustainable future while fostering responsible business practices. Our sustainability efforts extend beyond our operations to our supply chain through our Sustainable Procurement Policy, encouraging vendors to align with our environmental standards.
Good & Green Vision and 2025-26 Goals
Aligned with our Good & Green vision, we have set ambitious environmental sustainability goals for 2025-26:
- Greener Products: One-third of our products will be demonstrably greener compared to 2020 levels.
- Renewable Energy Transition: At least 80% of our energy will come from renewable sources.
- Waste Management: We will maintain our zero waste to landfill status.
- Energy Productivity: As part of our EP100 commitment, we aim to double our energy productivity by 2030.
Data-Driven Sustainability Approach:
We continuously monitor energy consumption, emissions, water usage, and renewable energy adoption across all our facilities under full operational control. To make informed decisions, we integrate carbon and water pricing, ensuring financial and environmental considerations are embedded throughout our value chain.
Tracking & Governance:
To measure and track progress, we follow globally recognized frameworks, including the IPCC Guidelines for National Greenhouse Gas Inventories (2006) and the IPCC AR6 Assessment Report. Our corporate sustainability team oversees these efforts, working closely with manufacturing cluster heads and on-site teams.
Key Sustainability Practices
- Stakeholder Engagement: We conduct regular meetings with internal and external stakeholders to align priorities, budgets, and expected benefits.
- Target-Driven Approach: Clear sustainability targets are embedded in our manufacturing processes and product lines.
- ‘Green Champions’ Initiative: Designated team members integrate sustainability goals into their core responsibilities within our annual operational plan.
- Sustainability Tracking & Reporting: An internal sustainability tracking tool enables data collection, analysis, and monthly reports on key metrics, including carbon emissions in line with the GHG Protocol.
- Best Practice Sharing: We actively promote successful sustainability practices through internal platforms for broader adoption.
- Robust Governance & Performance Monitoring: We continuously assess and enhance sustainability performance through structured governance mechanisms.
- Targeted Improvement Plans: Underperforming units are identified, and strategic action plans are implemented for efficiency enhancements.
- Innovation-Driven Sustainability: We have established an innovation unit to explore and implement advanced sustainability solutions with a medium- to long-term focus.
- ESG Disclosures & Benchmarking: We participate in industry-standard ESG disclosures, ensuring transparency and benchmarking against peers. External consultants are engaged for specialized initiatives, such as materiality assessments and climate risk evaluations.
Enhancing our manufacturing processes to support
a more sustainable future
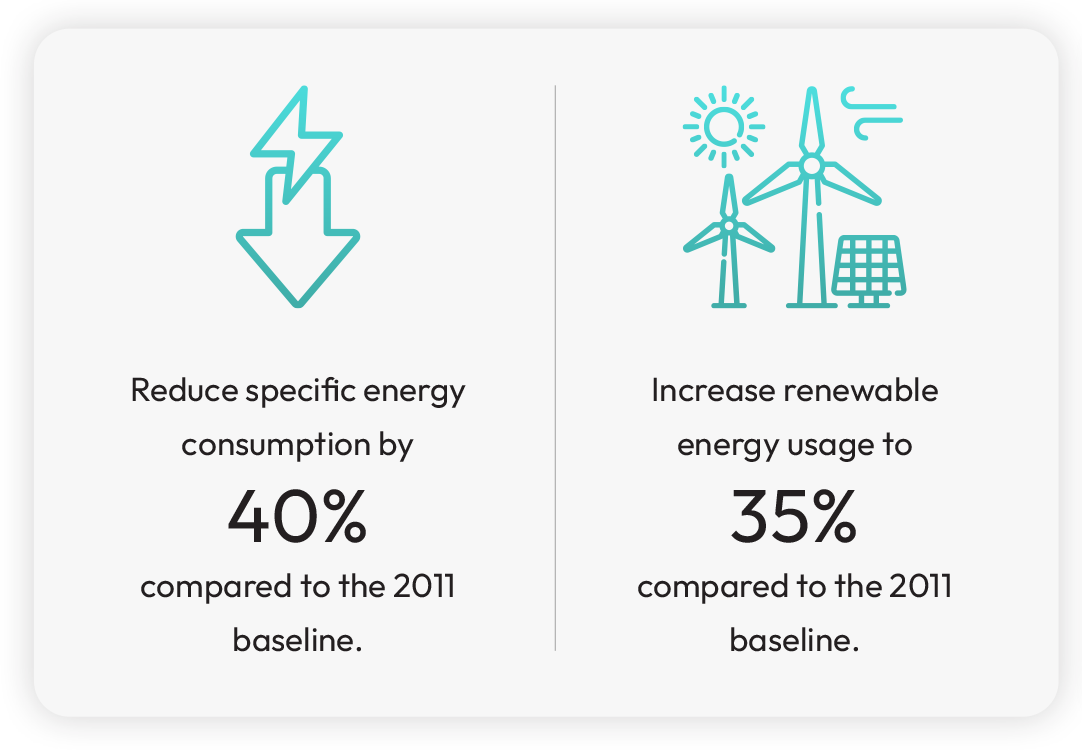
Our goals & progress
01
Energy*

Reduce specific energy consumption by 40% by FY 2026 (v. 2011 baseline)
Our Approach
Energy Efficiency & Renewables:
- Enhancing system efficiency through process improvements
- Integrating solar and biomass energy sources
- Upgrading technologies for better performance

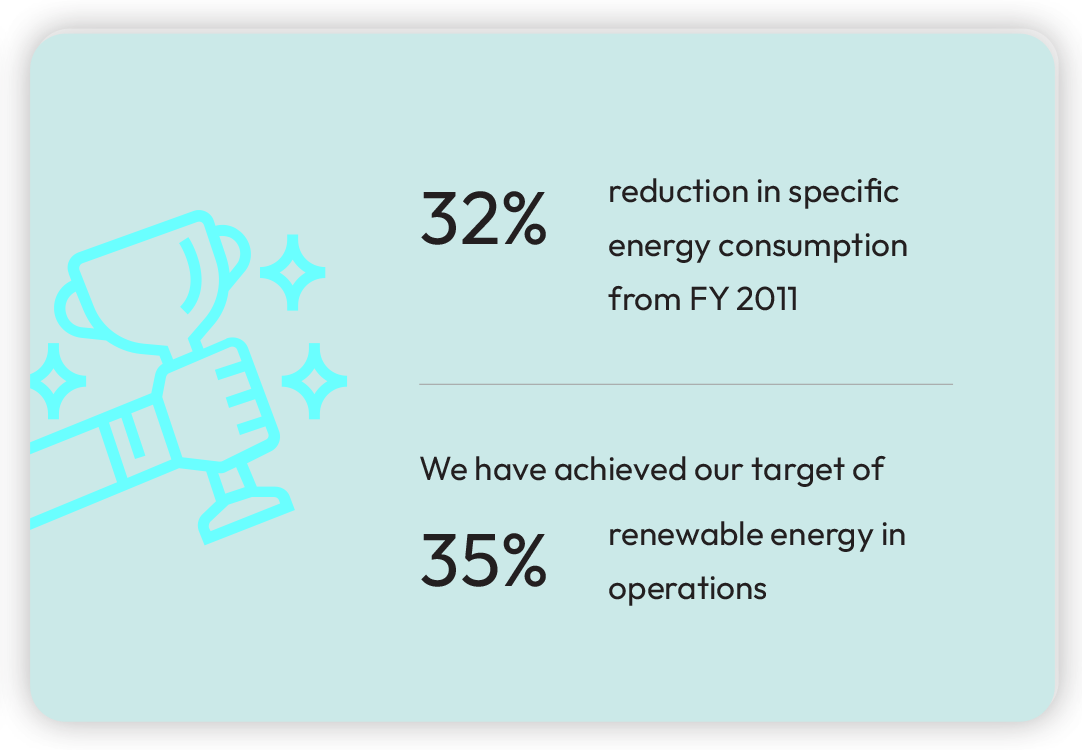
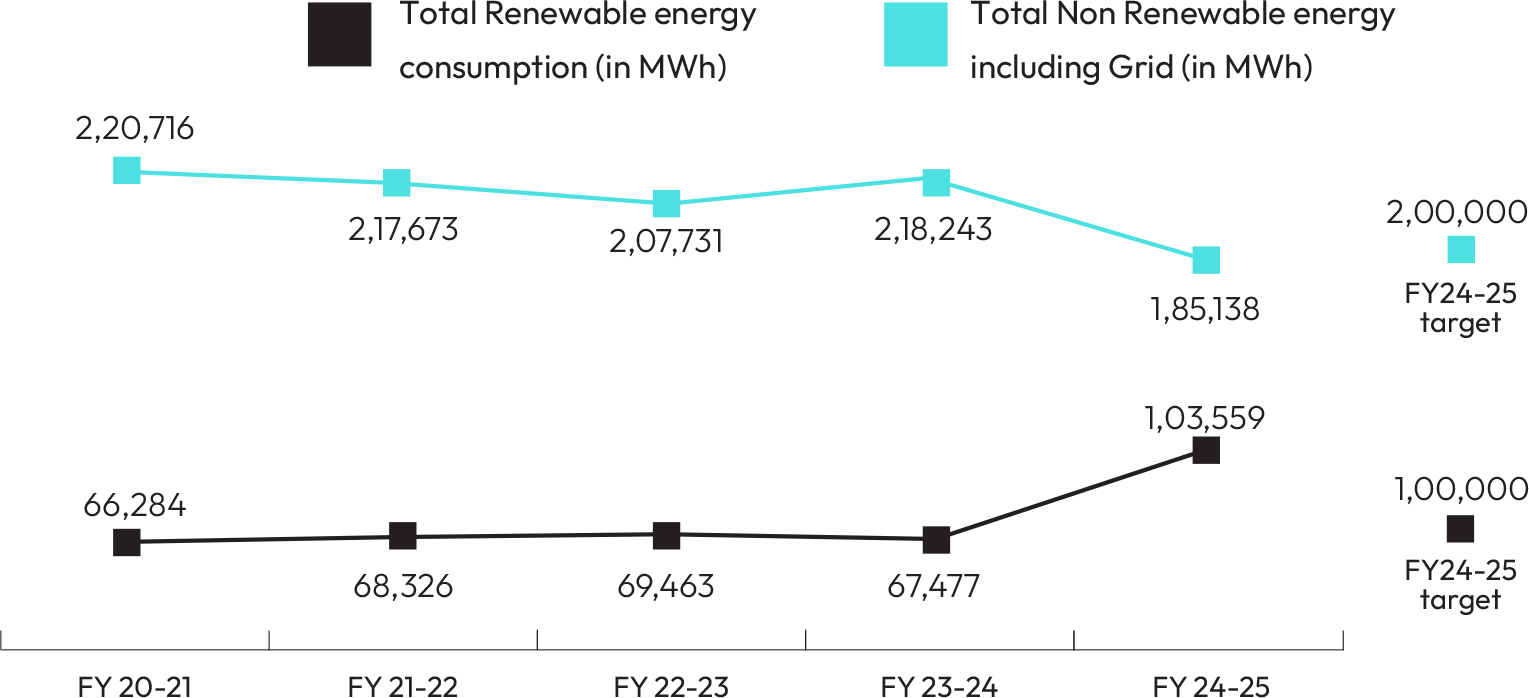
- Specific energy consumption reduced by 32%.
- Renewable energy portfolio increased to 35%.
02
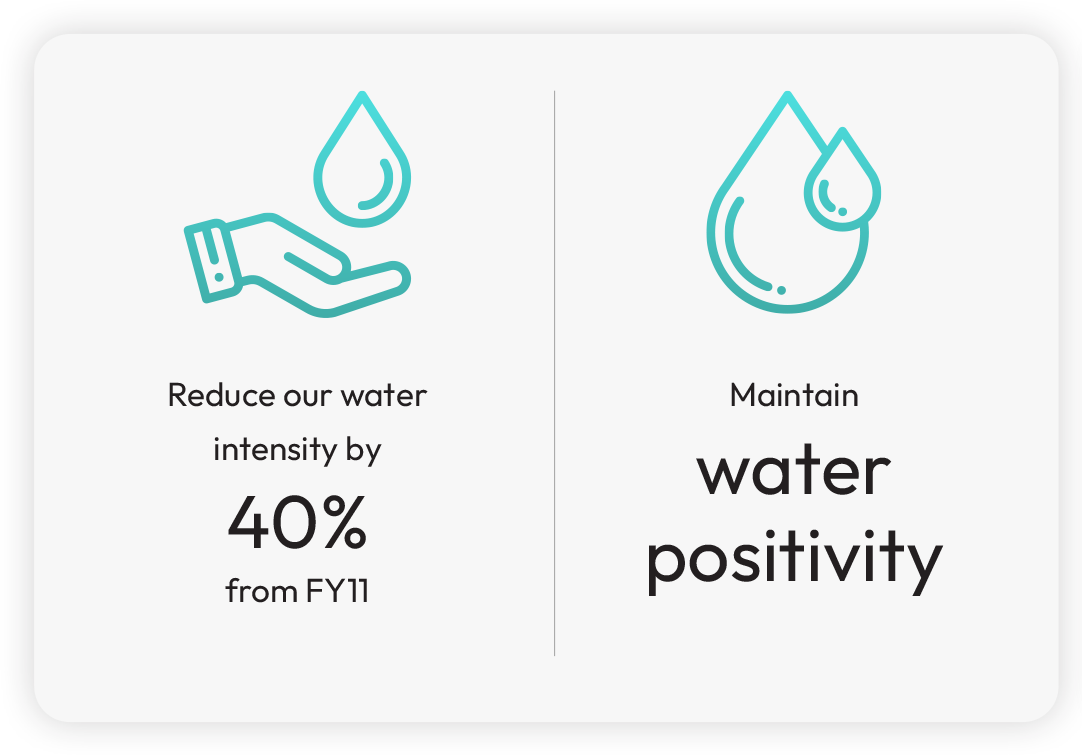
Water**

Reduce water intensity by 40% by FY 2026 (v. 2011 baseline) while maintaining water positivity
Our Approach
Water Management & Conservation:
- Implementing advanced water management systems
- Launching a comprehensive watershed initiative
- Utilizing technology for optimized water usage
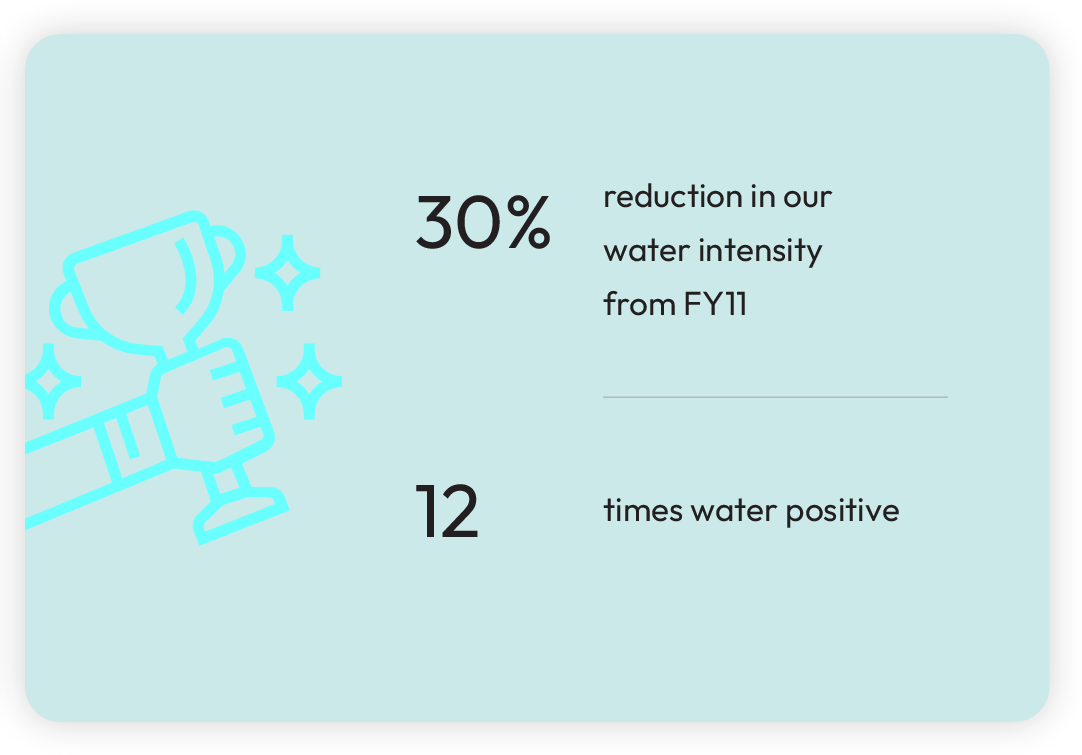
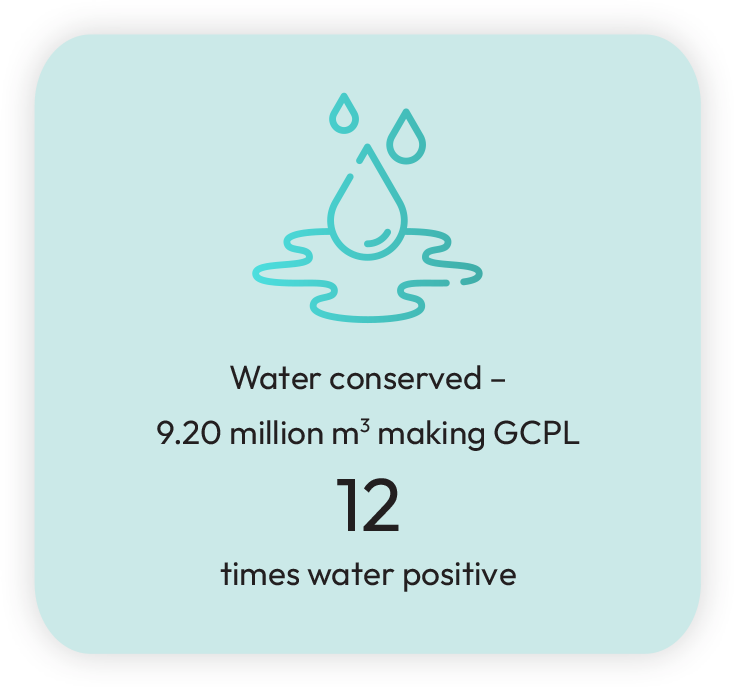
- Water intensity reduced by 30%, achieving 12x water positivity (we conserve 12 times more water than we use through rainwater harvesting and community watershed programs).
03
Emissions***

Reduce GHG emission intensity by 45% by FY 2026 (v. 2011 baseline)
Our Approach
- Incorporating sustainable energy sources such as biomass while continuously improving operational efficiencies.
- GHG emission intensity reduction by 47%
04
Waste

Sustainable packaging commitment
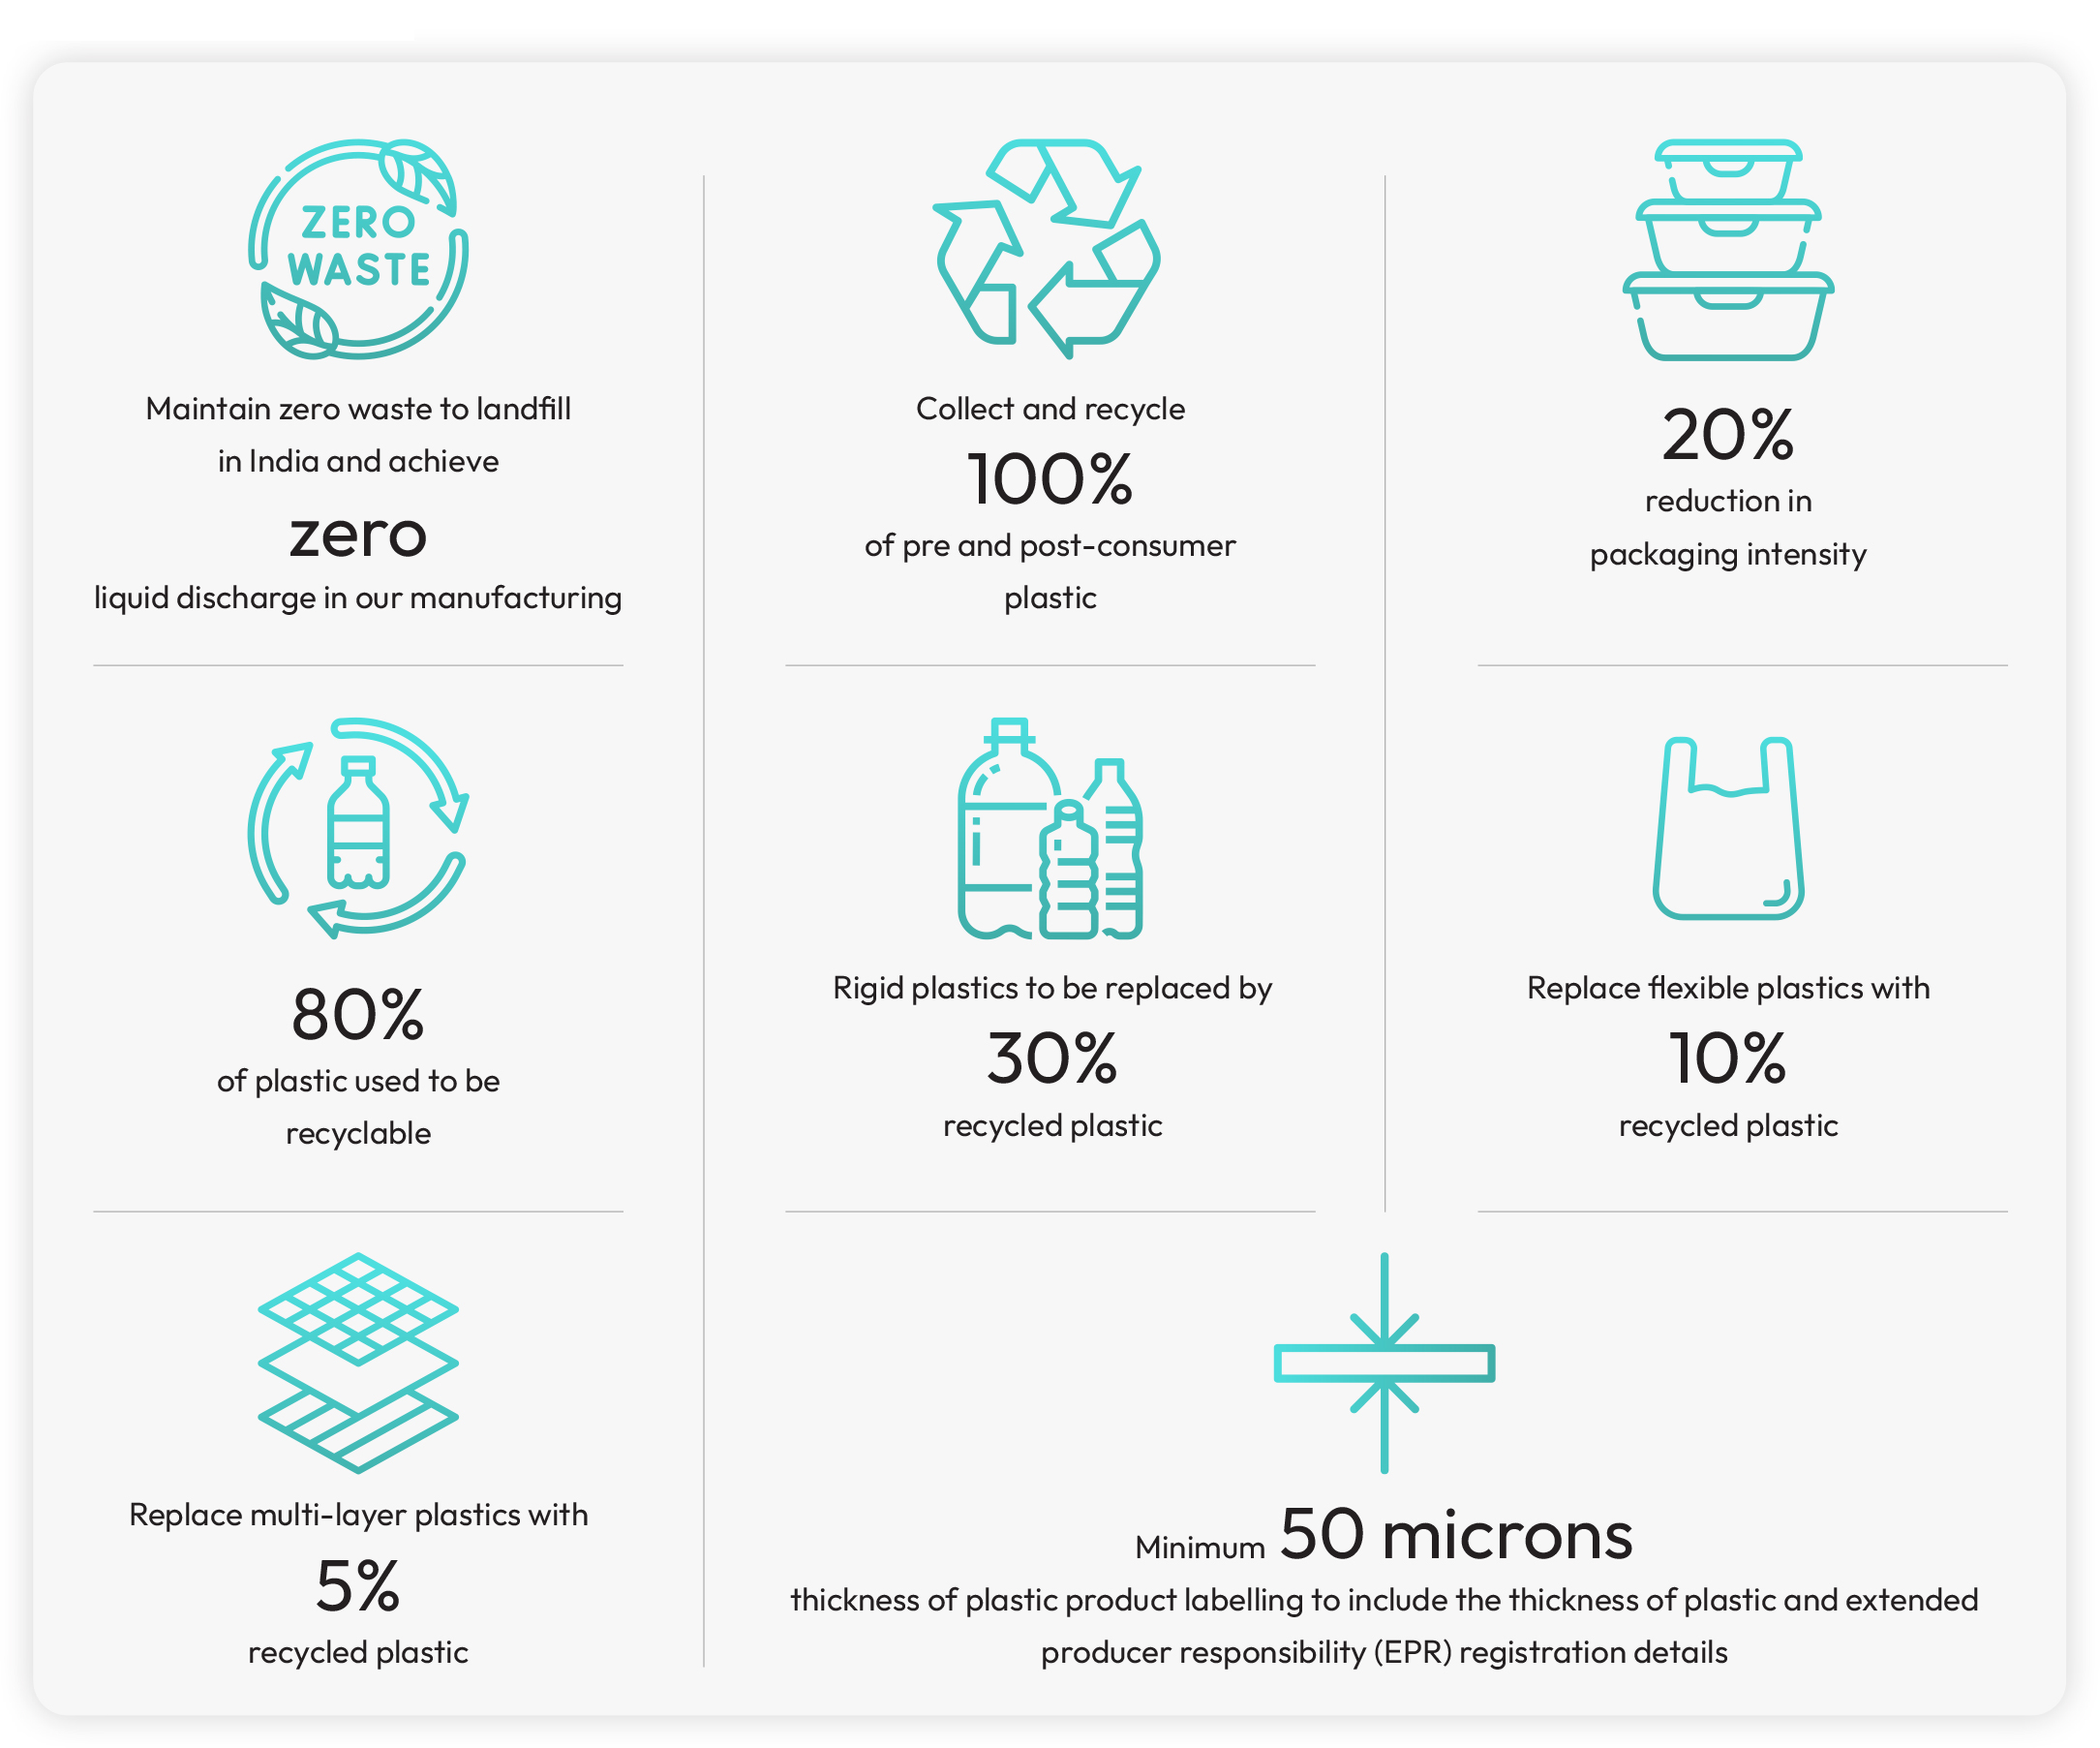
- Achieve zero liquid discharge & maintain zero waste to landfill
- Collect and recycle 100% of pre- and post-consumer plastic
- Ensure a minimum 50-micron thickness for plastic product labelling, including plastic thickness details and Extended Producer Responsibility (EPR) registration.
- Reduce packaging intensity by 20%.
- Ensure 80% of plastic used is recyclable.
- Rigid plastics will be replaced with 30% recycled plastic by FY 2025-26, while flexible plastics and multi-layer plastics will incorporate 10% and 5% recycled plastic, respectively, by FY 2026-27.
Our Approach
- Strategically optimizing materials through innovative approaches such as reuse and recycling, fostering greater circularity.
- Establishing a comprehensive monitoring framework to track and implement initiatives focused on minimizing plastic packaging consumption and intensity.
- Collaborating with vendors and businesses to increase the use of PCR plastic as a substitute for virgin plastic, reinforcing our sustainability objectives and commitment to environmental responsibility.
- 100% waste diversion from landfills.
- Plastic neutrality in India – 100% of pre- and post-consumer plastic collected and recycled.
- Significant reduction in plastic packaging intensity.
* Energy use is measured by specific energy consumption per tonne of production.
** Water usage is measured by specific water consumption per tonne of production.
*** Emissions are tracked for Scope 1 and 2, calculated by specific GHG emissions per
tonne of production.
1. Energy
The year 2024 was one of the warmest on record since 1850, serving as a stark reminder of the escalating climate crisis. While this presents significant challenges, it also creates opportunities for innovation and resilience, with businesses like ours playing a crucial role in fostering sustainability. Additionally, fossil fuels are finite and subject to price volatility. That’s why energy efficiency and renewable energy are central to our operations. By reducing energy consumption, we lower costs, and by transitioning to renewable energy sources, we achieve long-term savings while minimizing operational expenses.
Our comprehensive approach includes upgrading to energy-efficient equipment, adopting renewable technologies, and embedding energy-saving practices across all manufacturing sites. Most of our manufacturing facilities are certified under ISO 14001 and ISO 9001 standards.
As of FY 2025, we have made significant progress toward this goal. Each of our manufacturing sites has integrated these goals into their annual operational plans (AOP), with plant heads accountable for reducing energy use, increasing renewable energy adoption, and ensuring measurable savings. The plant AOPs have quantified year-on-year targets on energy and renewables, based on their scale of operations. These targets cascade in to every one’s goal sheets and lead up to GCPL’s specific energy consumption and renewable energy use targets.
By FY2026, we aim to –
As of FY25, we have achieved-
We focus on process improvements to enhance energy efficiency while incorporating renewable sources such as solar and biomass. We have regular energy audits that help us identify inefficiencies and opportunities for optimization. These audits assess processes, equipment, and systems to pinpoint areas for improvement. Additionally, they highlight maintenance needs to ensure timely servicing, improving efficiency, preventing unexpected breakdowns, and avoiding production delays.
In FY 2024-2025, we have implemented over 60 energy initiatives. Some of our key energy initiatives are–
- In the Central West manufacturing cluster, we innovated to prioritize energy efficiency while designing our new soap plant. We invested and customised to develop a new biomass-based co-generation power plant. It utilizes renewable biomass briquettes as fuel source and efficiently generates both electricity (1.5 MW of power) and steam (25 TPH) for our operations. The set-up helps us save over 37,00,000 kWh of power and has set a new internal benchmark for our brownfield projects.
- In Central West manufacturing cluster, we incorporated an energy-efficient CSP (concentrating solar-thermal power) in the soap expansion plant. It has helped us save over 2,00,000 kWh of power. We installed mechanical seals in chemical plant process pump that reduces friction, prevents leaks, and enhances operating stability helping us save over 3,00,000 kWh of power. Additionally, we also installed power-saving VFDs, motion sensors in cabins vacuum pumps, and replaced the thermic fluid heater pump, among
- In Central West manufacturing cluster, we incorporated an energy-efficient CSP (concentrating solar-thermal power) in the soap expansion plant. It has helped us save over 2,00,000 kWh of power. We installed mechanical seals in chemical plant process pump that reduces friction, prevents leaks, and enhances operating stability helping us save over 3,00,000 kWh of power. Additionally, we also installed power-saving VFDs, motion sensors in cabins vacuum pumps, and replaced the thermic fluid heater pump, among other initiatives to optimize energy consumption.
other initiatives to optimize energy consumption.
- In our South Cluster, we have introduced energy-efficient BLDC fans, Unigas burners, servo-based coil clamp systems, as well as several process optimisations. Collectively, these actions have resulted in annual energy savings of over 2,22,000 kWh, helping us reduce energy use.
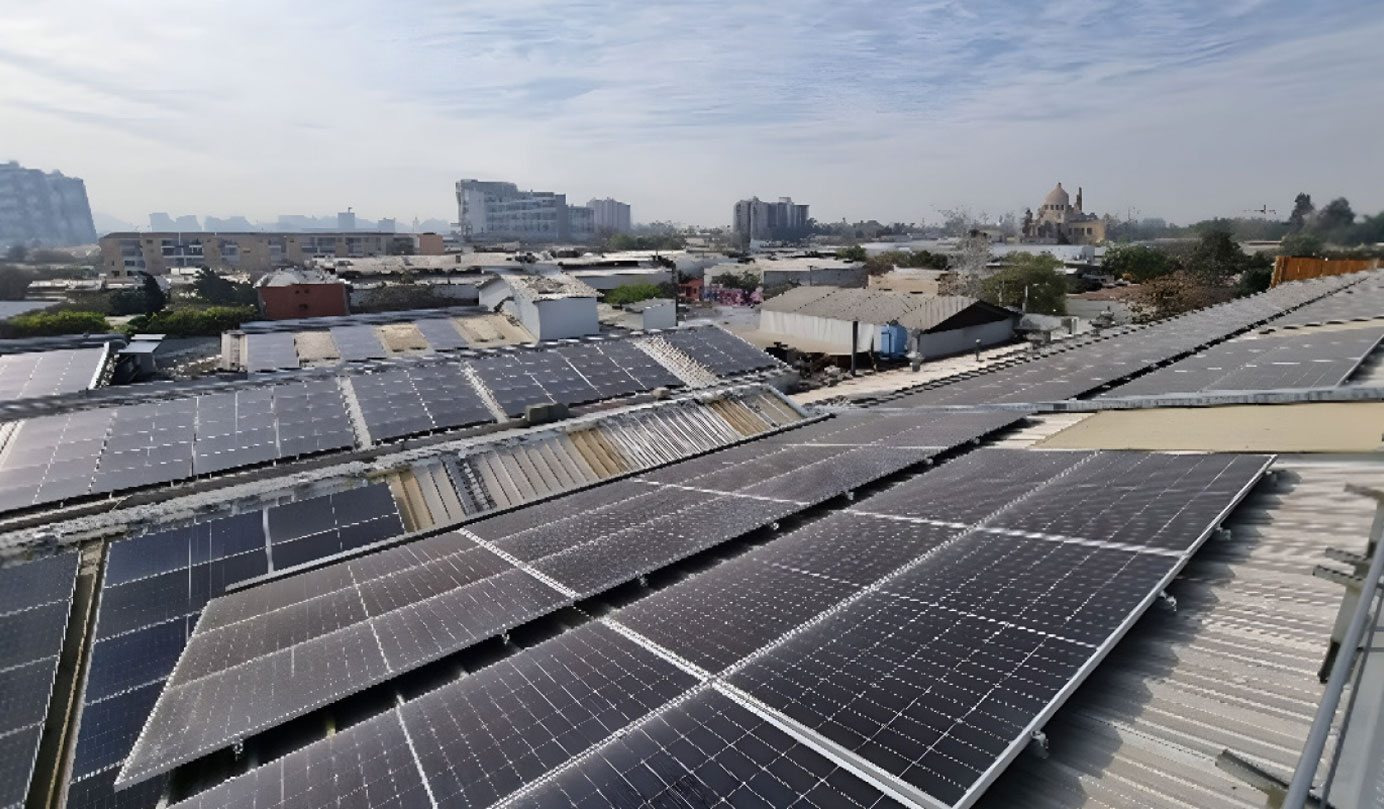
- In LATAM, our Chile plant installed solar roof-top panels. This helped 30% of the plant’s energy needs switch to renewable power and reduced energy costs by 20% while lowering emissions.
- Furthering our commitment to cleaner fuel alternatives, we transitioned to bio-waste fuels in place of furnace oil in the hot air generators at our South Cluster Pondicherry Coil plant . This shift has enabled the consumption of 3,861 MT of bio-waste fuel, contributing to emissions reduction and promoting circularity in fuel sourcing.
- In South clusters, to increase renewable energy adoption, we installed rooftop solar panels across three key units (CONSO, Coil 9, and Coil 6) with installed capacities of 99 kWp, 115 kWp, and 315 kWp respectively. Together, these installations generated 6.93 lakh units of electricity, resulting in an estimated carbon emissions reduction of 414 metric tons for the year.
- Our energy audits across Northeast cluster helped identify multiple leakage points in compressed air systems. We addressed these inefficiencies by investing in the replacement of default valves and pipes, successfully sealing the leaks. We also installed Auto Air Cut-off System in our air compressors, automatically reducing air wastage during idle machine time. We installed motion sensors across utilities like lights, fans, and exhaust systems, driving energy savings and optimal resource use. Additionally, high-speed automated flow wrap machines replaced inefficient equipment at our Lokhra-II and Sikkim units, contributing to energy-efficient production and improved throughput. A further boost to energy efficiency came with the installation of an advanced automated compressor, replacing two inefficient ones and resulting in 22% energy savings.
Twice annually, we host green manufacturing conference, bringing together Green Champions from different manufacturing sites to exchange best environmental practices. These conferences serve as a platform for increasing awareness about energy efficiency initiatives, offering training on the latest technological advancements in conservation and renewable energy solutions. We also invite industry experts to share their insights and innovations, helping to further develop our team’s expertise in sustainable operations.
The Green Manufacturing Governing Council, chaired by the Managing Director of Godrej Industries Group, ensures strategic alignment of environmental goals with business operations. GCPL’s board-level ESG Committee conducts quarterly reviews of environmental performance. Our sustainability monitoring tool systematically records and evaluates data on production, resource consumption, and waste generation - both hazardous and non-hazardous. It also calculates the carbon footprint in accordance with established GHG protocols. For units that underperform, we collaborate with plant heads to develop targeted action plans aimed at improving sustainability performance.
Impact initiative
Transitioning to Renewable
Energy at Chile
In LATAM, our Chile plant was exploring opportunities to replace energy from fossil fuels to cleaner sources to reduce their environmental impact. The plant started installing solar roof-top panels in phases and have now covered complete roof-top area of the plant. This project helped divert close to 30% of the plant’s energy needs to renewable power and reduced energy costs by 20%. The project also helps reduce the plant’s emissions by 482 tCO2e.
We strictly adhere to all applicable environmental laws and regulations in the regions where we
operate, ensuring full compliance with local requirements.
Our energy consumption
Global energy consumption (in MWh)
Global energy consumption (in MJ) and energy intensity (in MJ/MT of product)
| FY 2024-25 | FY 2023-24 | |
|---|---|---|
| Energy intensity MJ/MT of product | 2,159 | 2,111 |
| Global energy consumption (MJ) | 1,04,38,61,320 | 1,05,41,10,885 |
Non-renewable sources (in MJ)
| FY 2024-25 | FY 2023-24 | |
|---|---|---|
| Liquified Petroleum Gases | 14,68,840 | 32,72,498 |
| HSD / Gas / Diesel oil | 4,72,39,299 | 4,94,10,847 |
| Natural gas | 27,75,26,418 | 31,09,64,213 |
| Petcoke | 50,47,120 | 3,32,50,750 |
| Furnace Oil | 12,54,88,503 | 19,04,68,878 |
| Grid Electricity | 21,14,87,534 | 22,38,27,632 |
| CNG | 11,520 | - |
| Petrol | 27,79,909 | - |
| Total non-renewable | 67,10,49,143 | 81,11,94,819 |
Renewable sources (in MJ)
| FY 2024-25 | FY 2023-24 | |
|---|---|---|
| Briquette | 11,02,92,055 | 15,27,57,595 |
| Wood Biomass | 7,65,57,796 | 6,24,18,221 |
| Solar Electricity | 1,47,03,520 | 73,49,944 |
| Green Electricity | 2,10,90,648 | 2,03,90,306 |
| Electricity Exported from Turbine | 14,82,814 | - |
| Pitch | 3,74,13,997 | - |
| Steam purchased | 11,12,71,347 | - |
| Total renewable | 37,28,12,177 | 24,29,16,066 |
2. Water
About half of the world’s population is facing extremer water scarcity. Parts of the world are experiencing excess rainfall while others are experiencing intense droughts. Climate change is expected to intensify the water cycle, leading to more frequent and severe droughts and floods. In the emerging economies where we operate, we also face poor water quality due to lack of wastewater treatment. Despite these challenges, there are opportunities for innovation and resilience-building.
At GCPL, we prioritize minimizing our water footprint and impact across our manufacturing operations, the products we create, and the communities we serve.
We are committed to reducing water usage throughout our value chain. Each of our manufacturing sites has integrated these goals into their annual operational plans (AOP), with plant heads accountable for reducing water use and improving rainwater harvesting. The plant AOPs have quantified year-on-year targets on specific water reduction, based on their scale of operations. These targets cascade into every one’s goal
sheet and lead up to GCPL’s specific water consumption targets. Additionally, we focus on protecting water resources in droughtprone and water-stressed regions where we operate.
We are committed to reducing water usage throughout our value chain. Each of our manufacturing sites has integrated these goals into their annual operational plans (AOP), with plant heads accountable for reducing water use and improving rainwater harvesting. The plant AOPs have quantified year-on-year targets on specific water reduction, based on their scale of operations. These targets cascade into every one’s goal sheet and lead up to GCPL’s specific water consumption targets. Additionally, we focus on protecting water resources in droughtprone and water-stressed regions where we operate.
We conduct regular water use assessments to measure consumption in our manufacturing processes, products, and operational regions. Our latest water audit was completed by CII, and it has helped us evaluate water usage in manufacturing and identify critical areas for optimization. We also organise in-depth lifecycle assessments, where we track the water footprint from raw material sourcing to the end-use phase of our products. We have also conducted a Task Force on Climate-related Financial Disclosures (TCFD) assessment, analysing key factors such as temperature, water scarcity, and precipitation, all of which play a crucial role in shaping climate change’s impact on our business.
Our water stewardship initiatives include –
- All our manufacturing plants in India follow a zero-liquid discharge process. Going beyond ETP, we use advanced wastewater treatment and recycling methods such as tertiary reverse osmosis. We ensure that all water used in our manufacturing is purified and repurposed within the plant.
- We have invested in multiple rainwater harvesting structures across our India manufacturing clusters that has enabled us to collect over 26,600 KL of water annually, reducing our reliance on freshwater sources.
- To further reduce our water consumption, we installed condensers and eco-taps, and fixed leaks in fire hydrant lines among other water conversation projects. This resulted in over 8,000 KL of water saving per year.
By FY2026, we aim to-
As of FY25, we have achieved-
We hosted virtual training and learning session for our Green Champions from across all Godrej Industries Group manufacturing sites. As part of this session, we provided an overview of challenges of water stress, initiatives of rainwater harvesting, water efficiency measures and ways of advance treatment and reuse of wastewater. We also enabled our sites to exchange their knowledge and share the best practices they follow. Additionally, we looked at examples of some cutting-edge technology solutions for water conservation, treatment, and recycling.
Global water withdrawal (in million cubic meters)
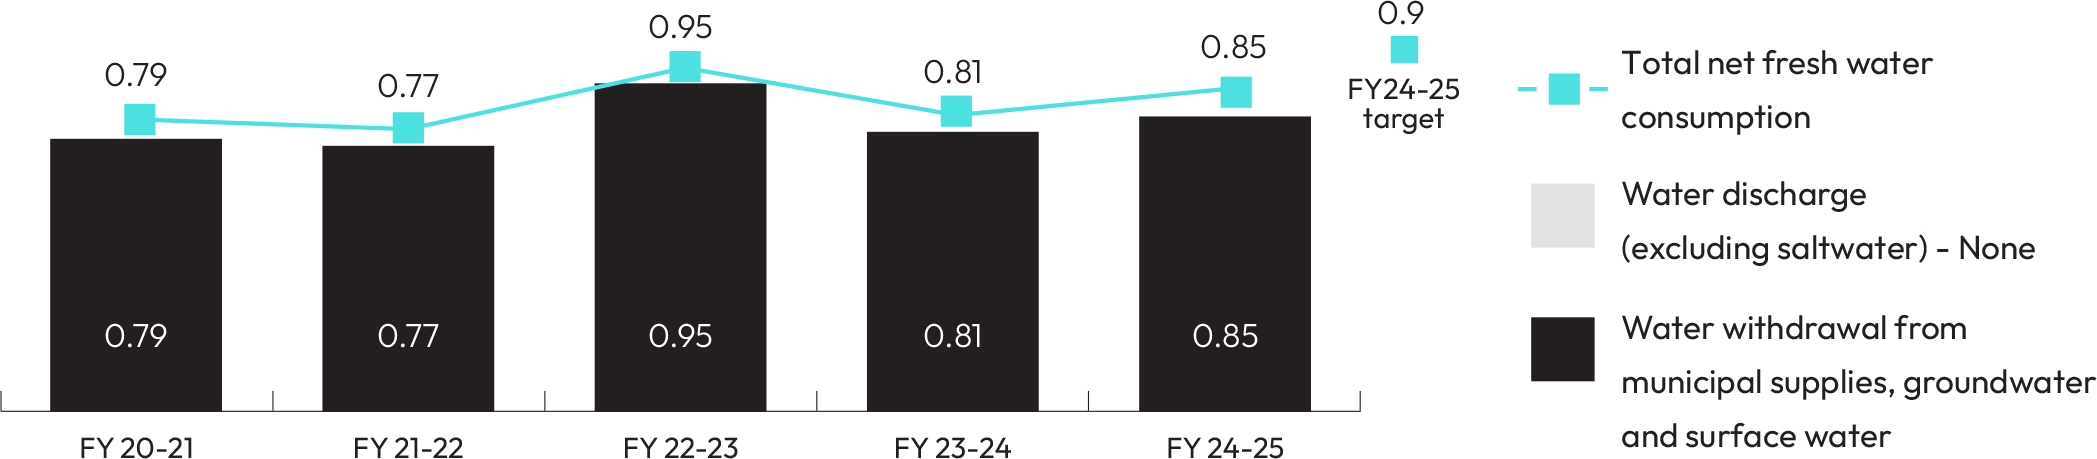
Global water consumption
(in Megalitres)
| FY 2024-25 | FY 2023-24 | |
|---|---|---|
| Ground water | 583.55 | 579.60 |
| Third party water | 177.36 | 224 |
| Surface water | 62.29 | - |
| Produced water | 0.60 | - |
| Total water withdrawal | 823.80 | 803.60 |
| Rainwater | 26.68 | 20.48 |
| Total water consumption | 850.48 | 824.08 |
Note: The values of total water consumption for FY 23-24 amounting to 2,857 has been restated to correct the comparative numbers, based on the correct unit of measurement.
Global water consumption from water
stress areas (in Megalitres)
| FY 2024-25 | FY 2023-24 | |
|---|---|---|
| Ground water | 397.86 | 458.62 |
| Third party water | 149.23 | 164.46 |
| Surface water | 15.81 | - |
| Produced water | 0.02 | - |
| Total water withdrawal | 562.91 | 623.08 |
| Rainwater | 3.16 | 5.11 |
| Total water consumption | 566.07 | 628.20 |
Note: The values of total water consumption for FY 23-24 amounting to 517.10 has been restated to correct the comparative numbers, based on the correct unit of measurement.
Impact initiative
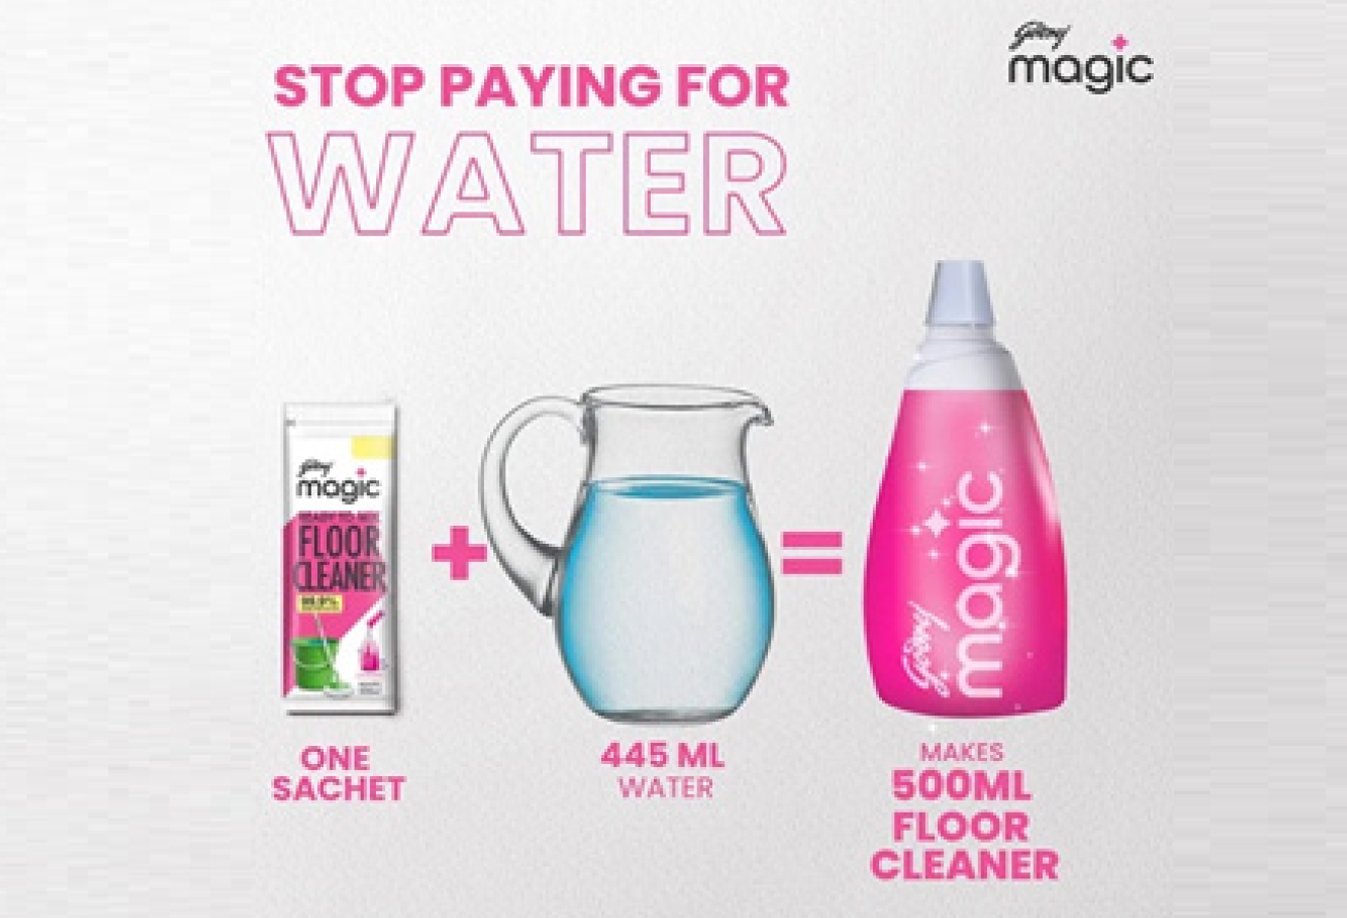
Our Godrej Magic personal care product range features a reconstituted formulation, designed to reduce water usage, plastic consumption, and transportation costs. Given that personal care products typically contain high water content, significant volumes of water are transported before production, making the finished product heavier and increasing fuel consumption during shipping. Our Magic Floor Cleaner is a unique ready-to-mix format that uses less plastic packaging, water and fuel to transport and resonates with our consumers need for affordable and sustainable life-choices.
Integrated community watershed management
Our integrated watershed development project aims to restore ecological balance in the drought-prone district of Siddipet, Telangana. In many areas, groundwater levels have fallen below 400 feet, placing immense strain on farmers. To address this challenge, we have partnered with NABARD and a local NGO to rejuvenate the land, replenish groundwater, support irrigation, extend cropping cycles, enhance produce quality and yield, improve farmer livelihoods, and promote sustainable agricultural practices. We restored and developed over 2,950 hectares of land, ensured afforestation and trained farmers in sustainable farming practices.
3. Emissions
Extreme weather events driven by climate change rank among the most significant global risks in both the short and long term. The effects of climate change are non-linear and exponential, causing severe consequences, particularly in vulnerable regions. We are committed to being part of the solution. Acknowledging the scale of the challenge, we remain steadfast in our efforts to reduce emissions. Our commitment is grounded in a well-defined climate change mitigation strategy, clear targets, and continuous progress assessments to measure our impact.
We track greenhouse gas (GHG) emissions, set short-term reduction targets, and aim for long-term net-zero Scope 1 and 2 emissions, alongside Scope 3 emission reductions through supplier engagement. Our efforts align with the Paris Agreement’s objective of restricting global temperature rise to 1.5°C. Additionally, we have implemented a robust energy efficiency program with specific reduction targets. Our goal is to double energy productivity by 2030, based on our 2018 baseline, in line with the Climate Group’s EP100 initiative. We also focus on minimizing air emissions from our manufacturing operations.
Here’s how we are greening our operations and reducing our emissions -
- We are expanding our renewable energy portfolio by replacing fossil fuels with biomass briquettes for most of our boilers, eliminating the need for furnace oil or diesel. We have also invested in captive solar energy at our facilities and are purchasing green power through third-party Power Purchase Agreements (PPAs) and open-access systems. Additionally, our new cogeneration plant at our largest manufacturing site in Malanpur has enhanced our renewable energy consumption to 35%.
- We are enhancing energy efficiency by upgrading to high-efficiency motors, installing variable frequency devices, and making process modifications to boost productivity while cutting energy consumption.
- We have optimized our transport management system to lower emissions by improving logistics and delivery routes, reducing mileage, and exploring greener transport alternatives and fuel-efficient vehicles. We collaborate closely with our logistics partners to ensure compliance with our environmental standards. Our investment in a transport management system has enhanced route planning, vehicle loading, and delivery scheduling, further improving efficiency and reducing emissions.
We strongly advocate for the goals of the Paris Agreement and remain committed to keeping global temperature rise within 1.5°C.
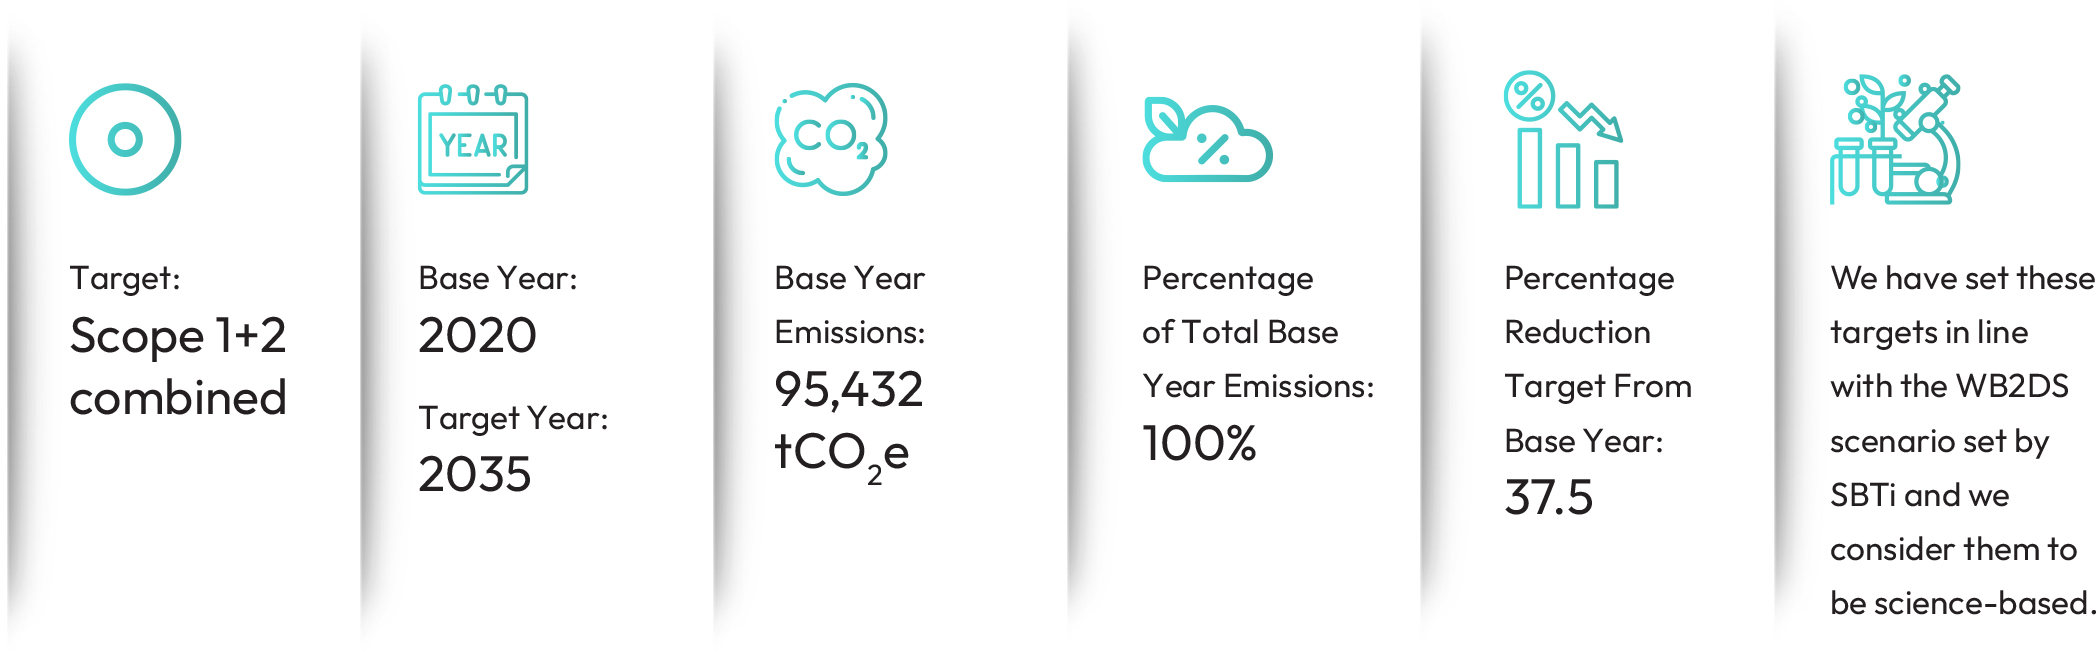
Emission reduction targets
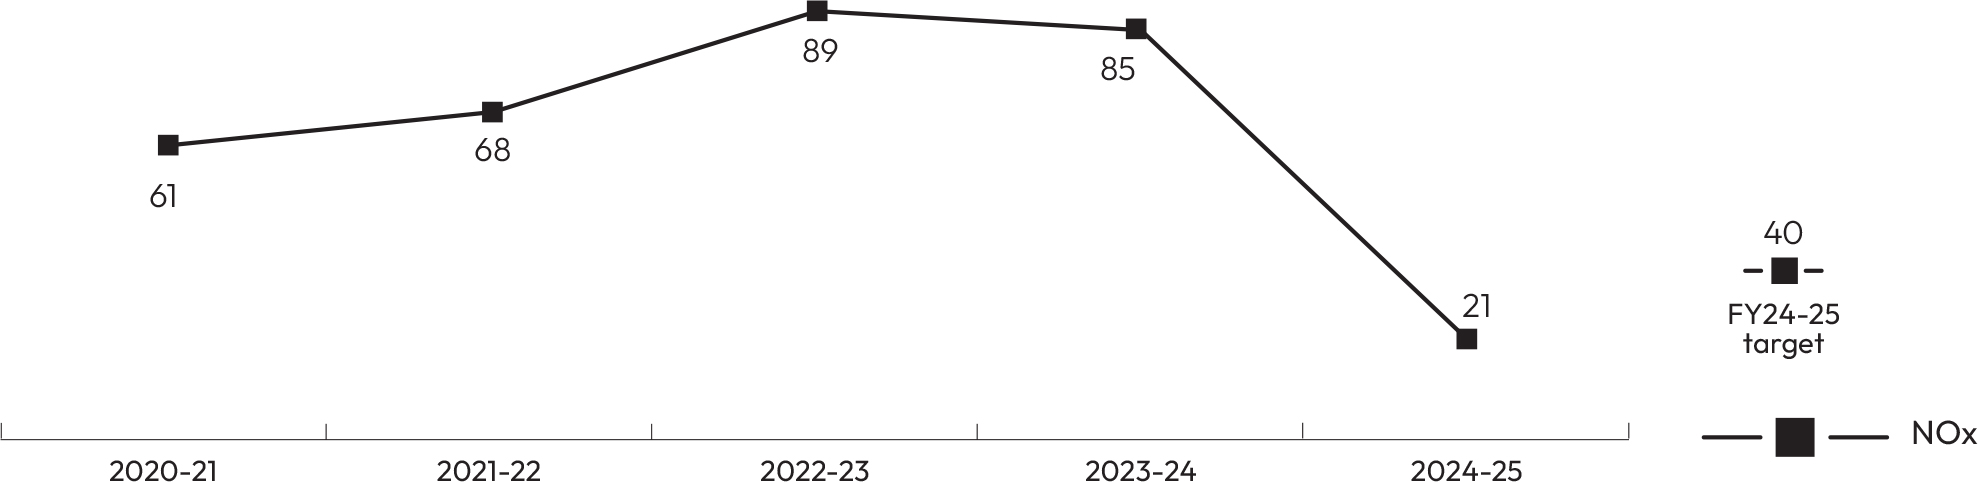
Nox emissions - India (MT NOx equivalent)
Global Scope 1 and 2 emissions (tCO2 equivalent)
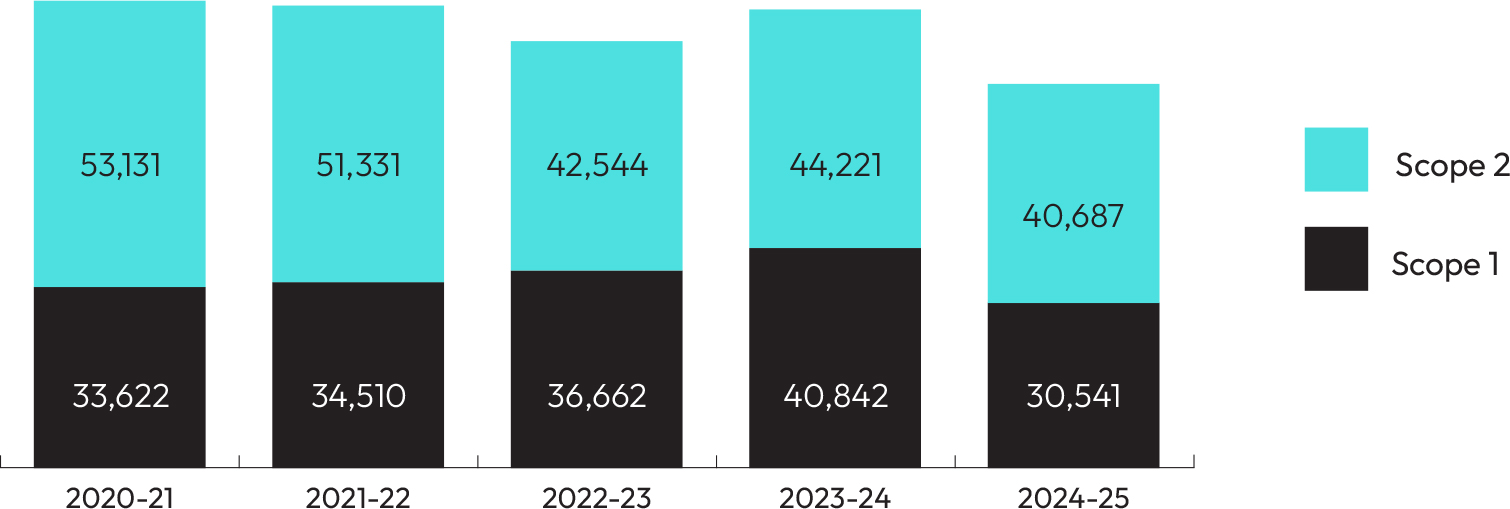
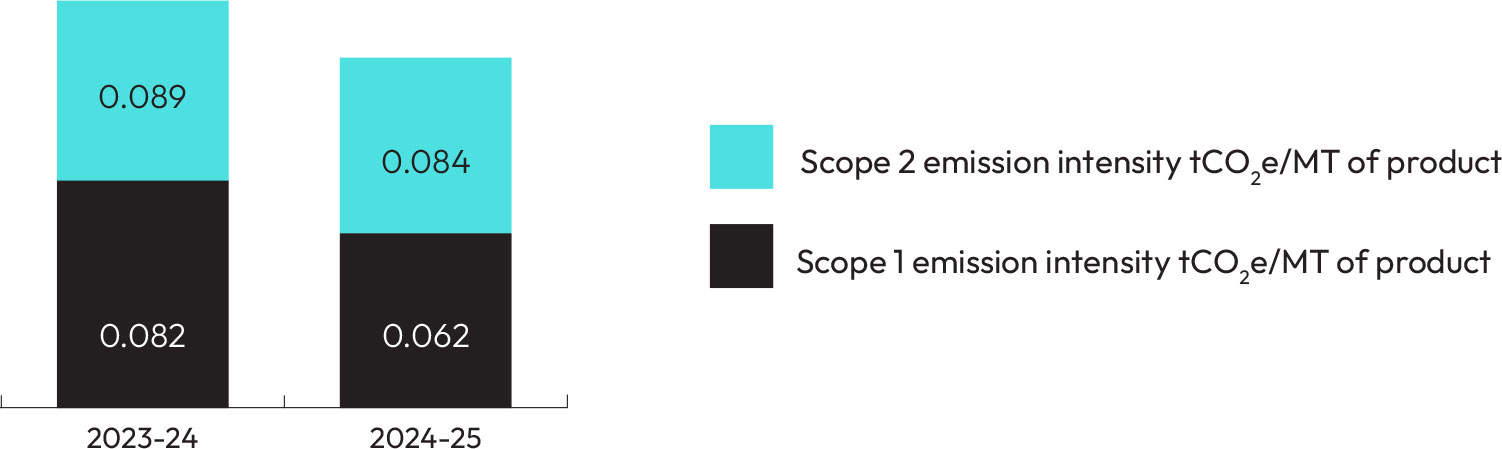
Scope 1 and 2: emission intensity (tCO2e/MT of product)
Our scope 1 and 2 net-zero roadmap till 2035
GCPL Emissions roadmap
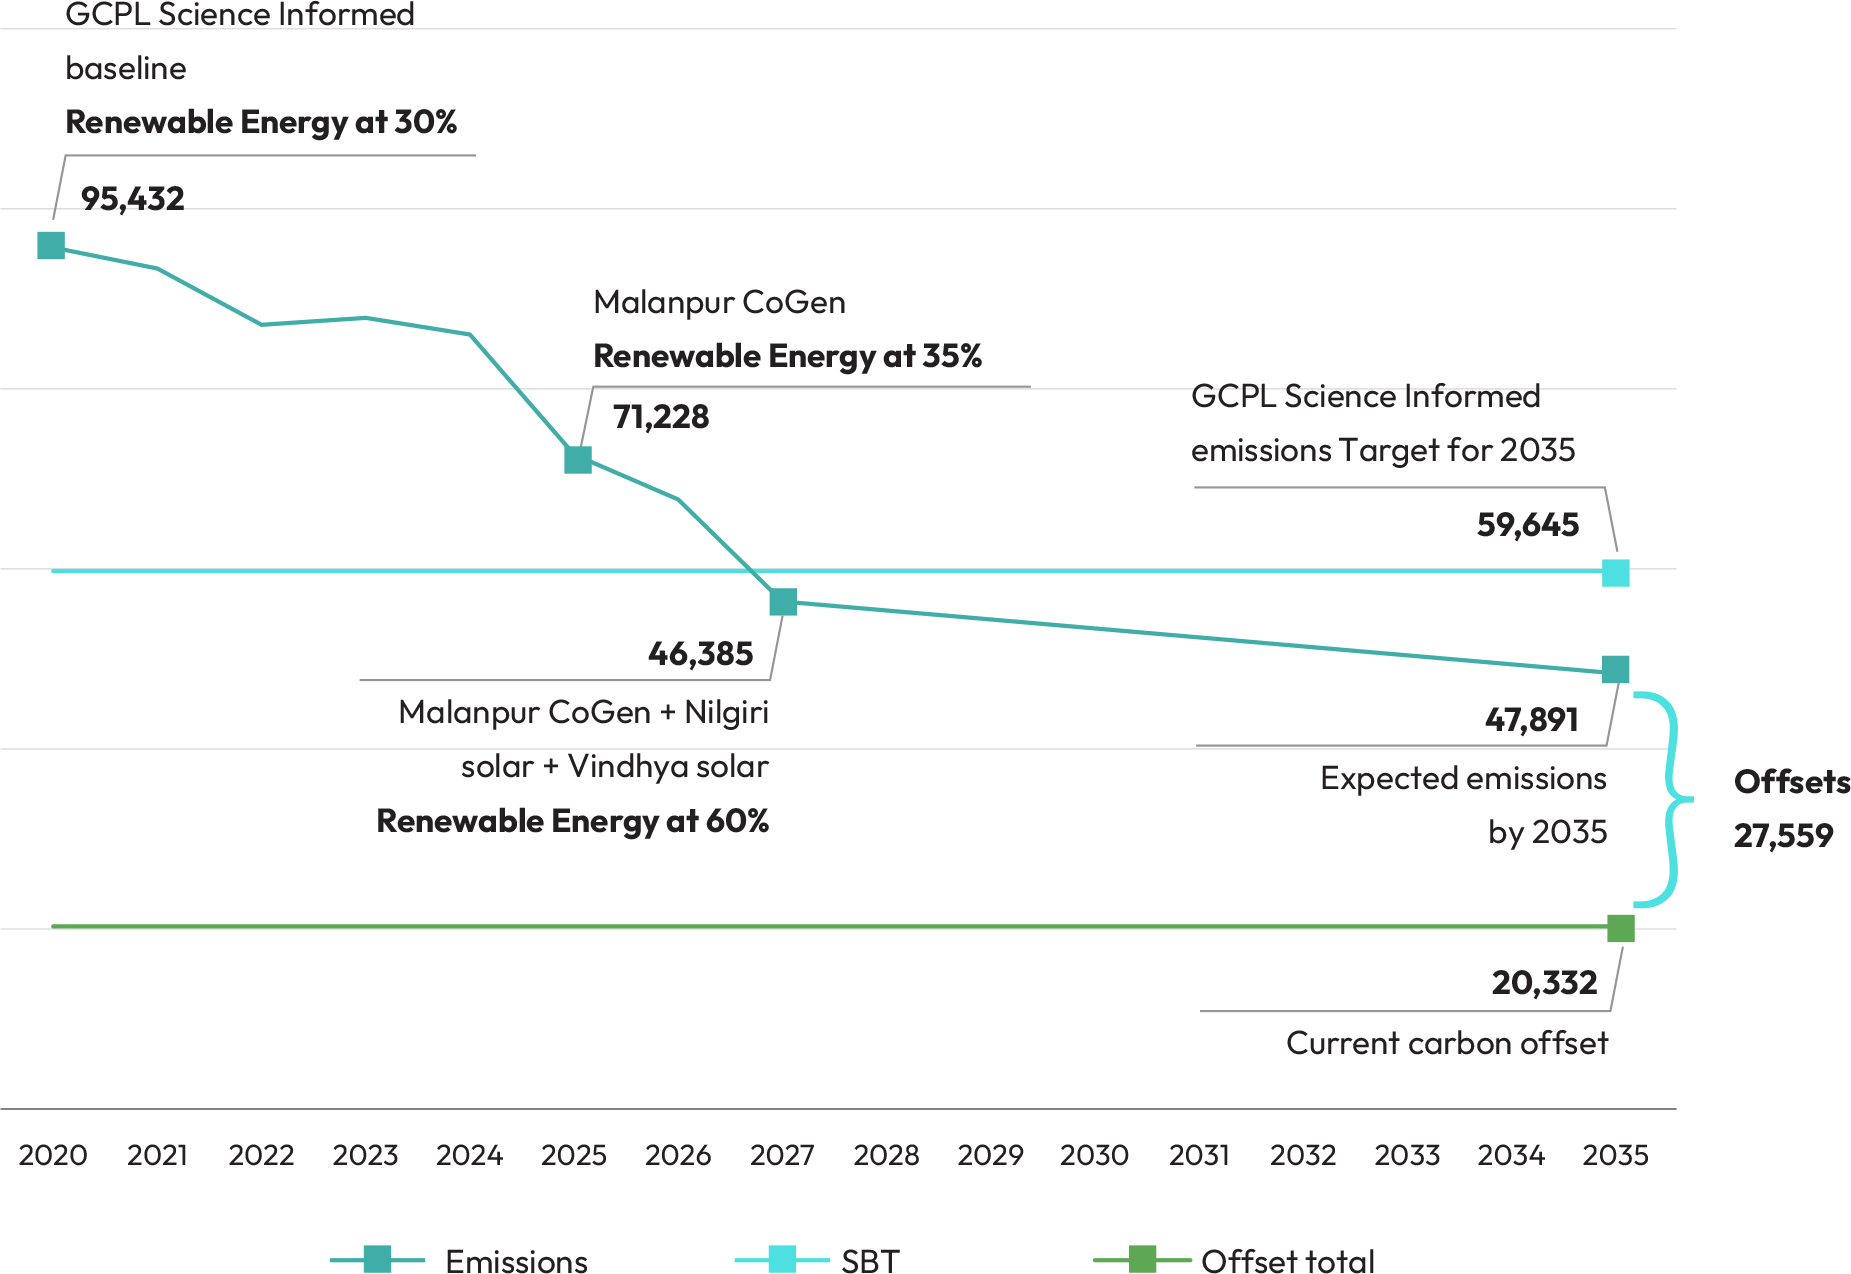
We employ a three-pronged strategy to reduce emissions and transition toward a net-zero future. Alongside our energy efficiency measures and expansion of renewable energy use, we are also investing in community-driven projects.
We have invested in afforestation projects on degraded land to establish carbon sinks and enhance carbon sequestration within our watershed programs. These efforts not only
We have invested in afforestation projects on degraded land to establish carbon sinks and enhance carbon sequestration within our watershed programs. These efforts not only conserve water and capture carbon but also restore ecosystems, protect biodiversity, and support local farmers' livelihoods. Currently, we are neutralizing about 20,000 MT of emissions annually through these initiatives. Based on our total annual emissions abatement and ongoing absolute emission reductions, we will continue investing in carbon offset projects to meet our target year goals.
conserve water and capture carbon but also restore ecosystems, protect biodiversity, and support local farmers' livelihoods. Currently, we are neutralizing about 20,000 MT of emissions annually through these initiatives. Based on our total annual emissions abatement and ongoing absolute emission reductions, we will continue investing in carbon offset projects to meet our target year goals.
Through regular supplier engagement and trainings, we are reducing our Scope 3 emissions.
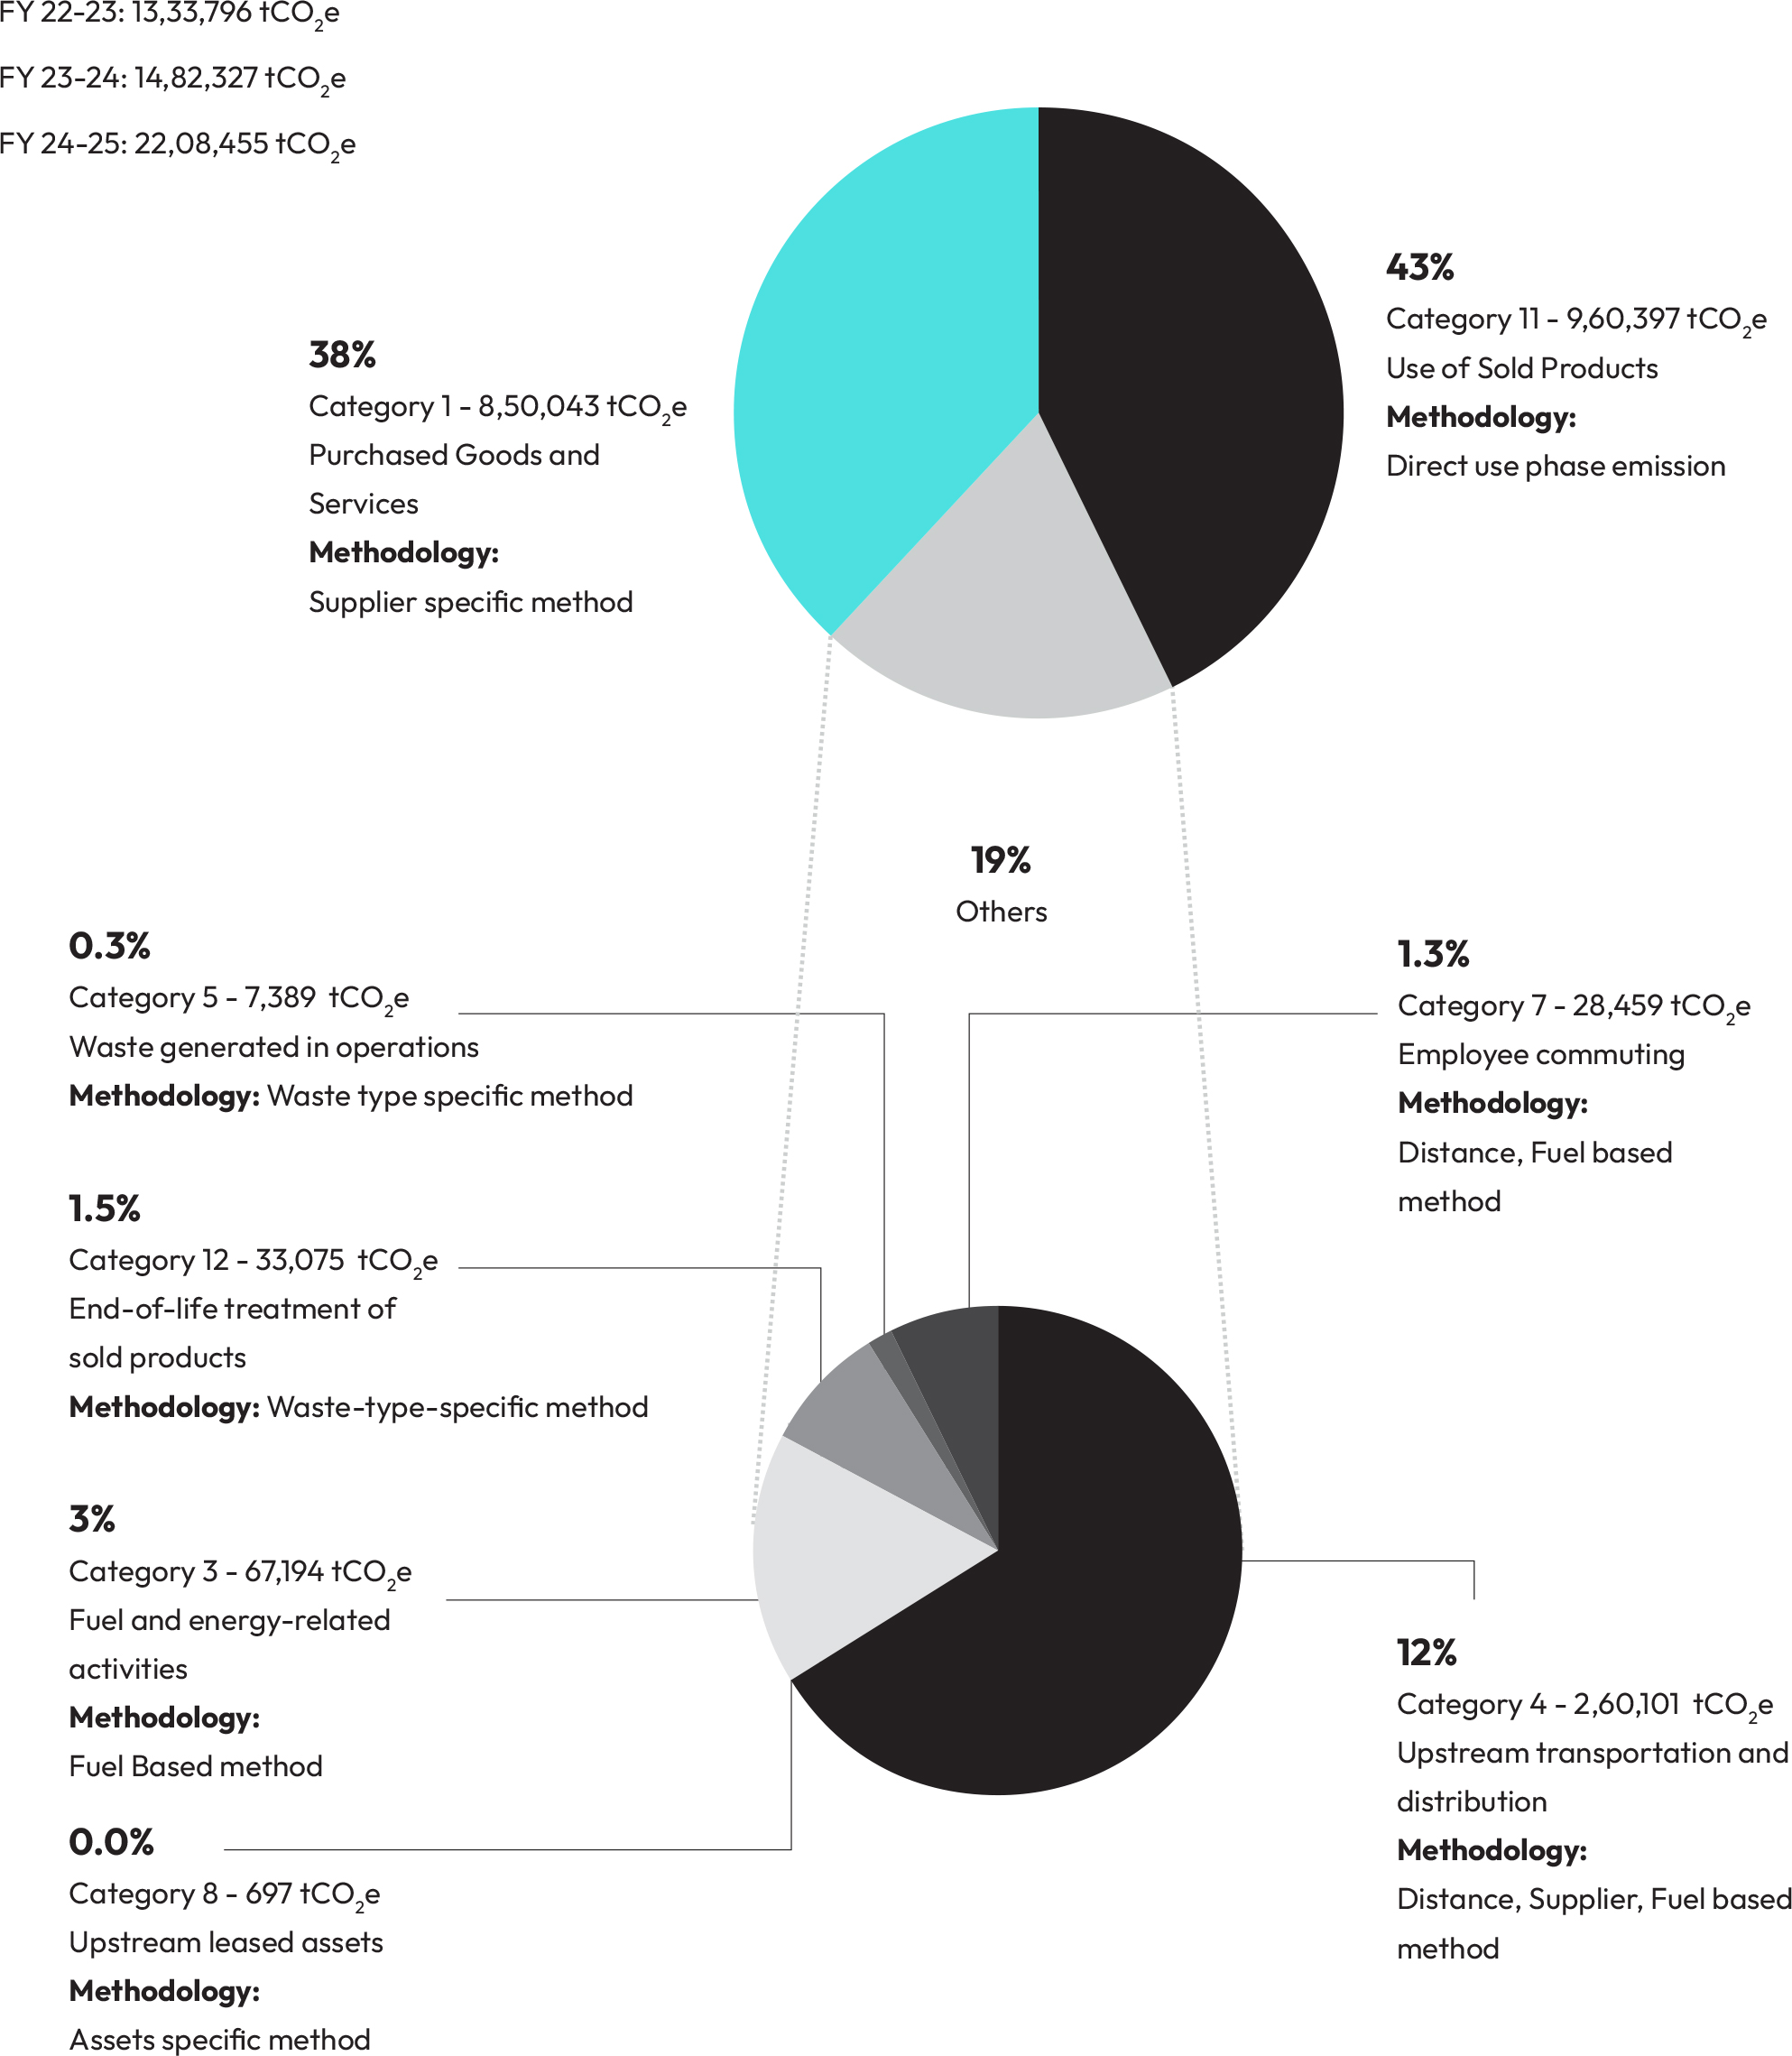
Scope 3 emissions - India (tCO2 equivalent) for FY 24-25
Our strategy for moving toward Net-Zero carbon/carbon neutrality
includes three key pillars:

Enhancing Energy Efficiency
We prioritize resource efficiency across our operations to minimize energy, water, and raw material consumption while maximizing productivity. This includes optimizing equipment capacity and transitioning from furnace oil-based boilers to briquette-fired boilers. We also collaborate with supply chain partners through our Sustainable Supply Chain program, sharing best practices and conducting sustainability audits. As a signatory of the EP100 global framework by the Climate Group, we have committed to halving our operational energy intensity by 2030, compared to a 2012 baseline. With a current reduction of nearly over 33%, we are on track to achieve this goal ahead of schedule.

Scaling Up
Renewable Energy Use
We are accelerating the adoption of renewable energy sources, including biomass-based co-generation plants, briquette-fired boilers, microturbines, and solar PV systems. Additionally, we contribute to circularity by selling biomass ash to local farmers for use as organic fertilizer.

Carbon Offsets
Through community-led waste management initiatives, we divert organic waste from landfills and invest in afforestation projects to establish carbon sinks. These projects not only cut emissions but also aid in water conservation, biodiversity protection, and livelihood enhancement for local communities.
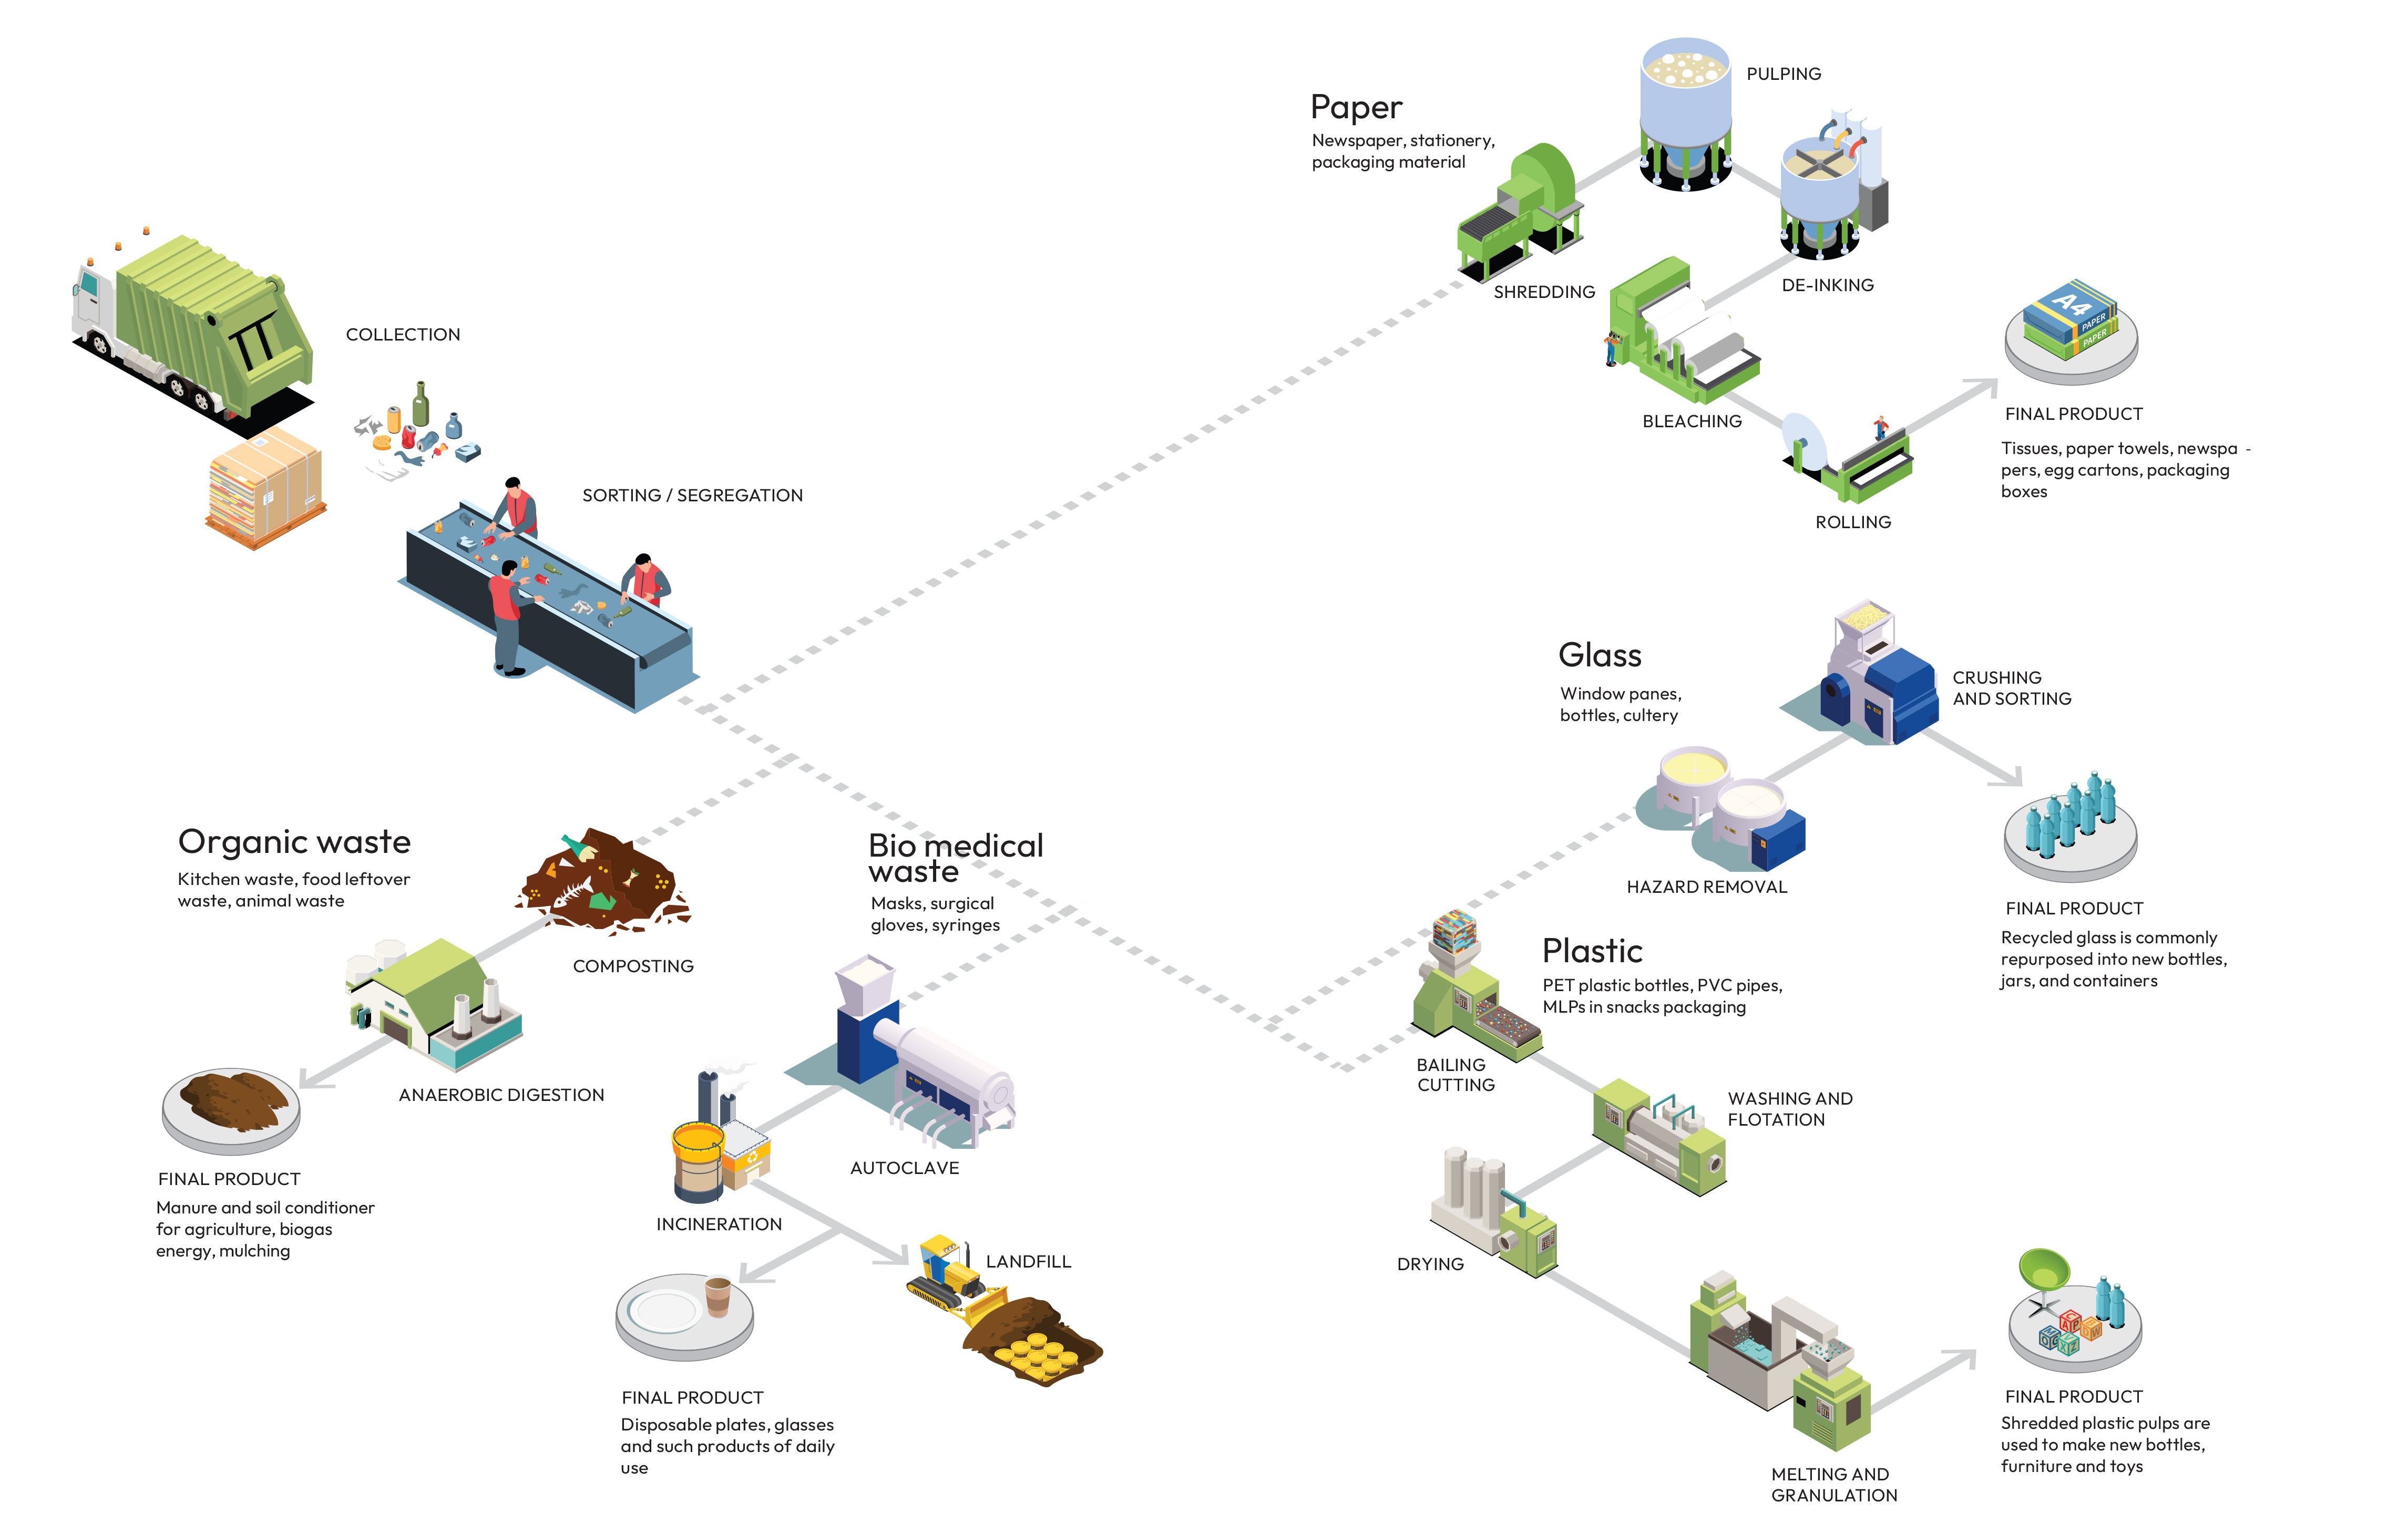
4. Waste
Every year, over 2 billion tonnes of solid waste are generated globally, yet less than 15% of it is recycled. The recycling rate for plastic waste is even more concerning, with only 9% of all plastic ever produced being recycled. Waste is a major contributor to climate change, releasing significant greenhouse gas emissions—particularly methane from landfills—which accelerates global warming.
Inefficient waste management not only depletes natural resources but also leads to severe pollution of air, water, and soil. It adversely affects local communities and ecosystems, posing serious health risks and diminishing overall quality of life. It is therefore critical to implement robust and efficient waste management practices to conserve resources, safeguard public health, and protect the environment.
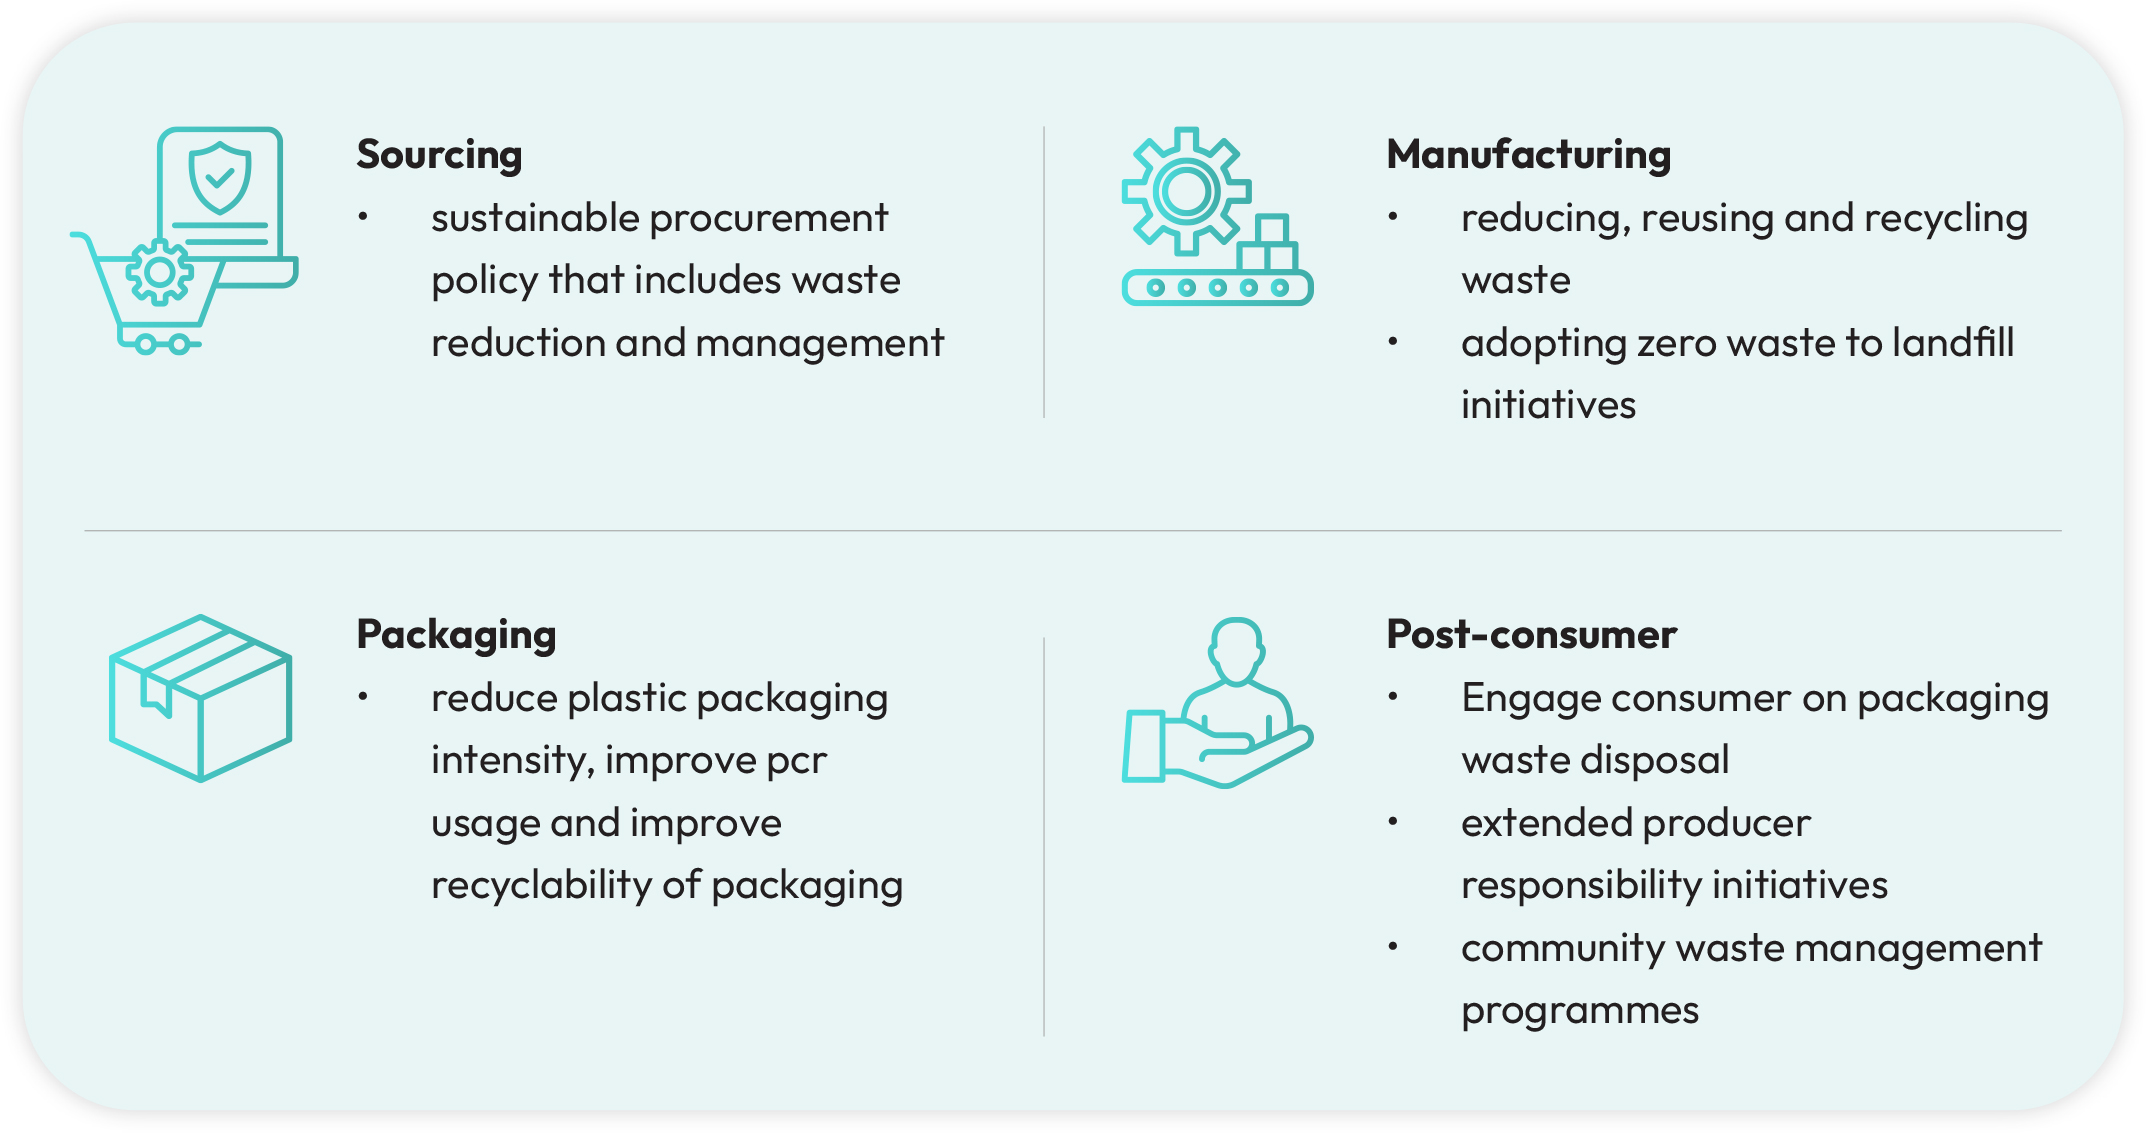
Scope of waste management
We manage waste across every stage of our value chain—from raw material sourcing and manufacturing to packaging and post-consumer disposal. Our goal is to minimise waste generation, maximise reuse, and ensure safe disposal of residual waste. Reducing our waste footprint not only helps mitigate environmental impact but also improves operational efficiency and reduces costs.
Waste we manage
By 2027, we aim to –
Our progress as of FY 2024-25 -
Manufacturing waste
Across all our manufacturing plants, we conduct comprehensive waste audits to collect data on waste generation, disposal methods, and areas of improvement. These assessments guide us in refining our waste management practices and aligning them with global best-in-class standards. Through detailed life cycle assessments, we map the complete waste footprint of our products—from raw material sourcing to end-of-life disposal.
Each of our manufacturing sites has integrated environmental goals into their annual operational plans (AOP), with plant heads accountable for reducing waste generation, ensuring waste is scientifically recycled and diverted from landfills. The plant AOPs have quantified year-on-year targets on waste reduction, based on their scale of operations. These targets cascade into everyone’s goal sheet and lead up to GCPL’s zero waste to landfill and zero liquid discharge targets.
These targets are reviewed quarterly at both the plant and corporate levels. Progress against these goals is also reviewed biannually by our Board ESG Committee.
We’ve implemented several impactful initiatives to reduce waste generation and promote recycling, thereby diverting significant volumes of waste from landfills:
- At our flagship Malanpur plant, Effluent Treatment Plant (ETP) sludge is recycled and sent for co-processing at a cement facility, enabling us to maintain our zero waste to landfill status for India operations.
- Sites across all four of our India regions have been assessed and certified by TUV India Private Limited as ‘Zero waste to Landfill’ and ‘Zero Liquid Discharge’ facilities.
- Our R&D initiatives are centered on reducing plastic waste. Through successful vendor trials, we included HMHDPE in our Coil flow wrap. This will contribute 5% post-consumer recycled (PCR) plastic in our packaging, reducing our dependency on virgin plastic.
- In Indonesia, Nigeria, Kenya, South Africa, and Mozambique, all waste from our manufacturing units are diverted to authorised recyclers. This global focus has helped us reduce waste to landfill year-on-year.
- We maintain full compliance with Extended Producer Responsibility (EPR) regulations. Our plastic packaging footprint in India stands at approximately 17,948 metric tons (MT). Since FY2021, we have remained plastic neutral, recovering an equivalent amount of plastic waste as we generate. In addition, we actively invest in community-based solid waste management programmes to strengthen local recycling infrastructure and promote circularity.
Impact initiative
At our Alrode PP plant in South Africa, we have made commendable progress in our waste reduction efforts, in line with our green goals. In FY 2025, we successfully brought down polypropylene (PP) waste from 6.5% to an average of 3.5%, achieving a waste reduction of nearly 50%. This translated into a substantial cost saving of I1.6 crore. We implemented multiple operational enhancements such as better machine performance to increase output, fewer machines in operation, minimized changeovers, reduction in quality-related losses, and the adoption of an optimal resin grade. This integrated approach has improved efficiency and significantly reduced material loss, reinforcing our commitment to waste reduction in our manufacturing operations.
Innovating for good and green products
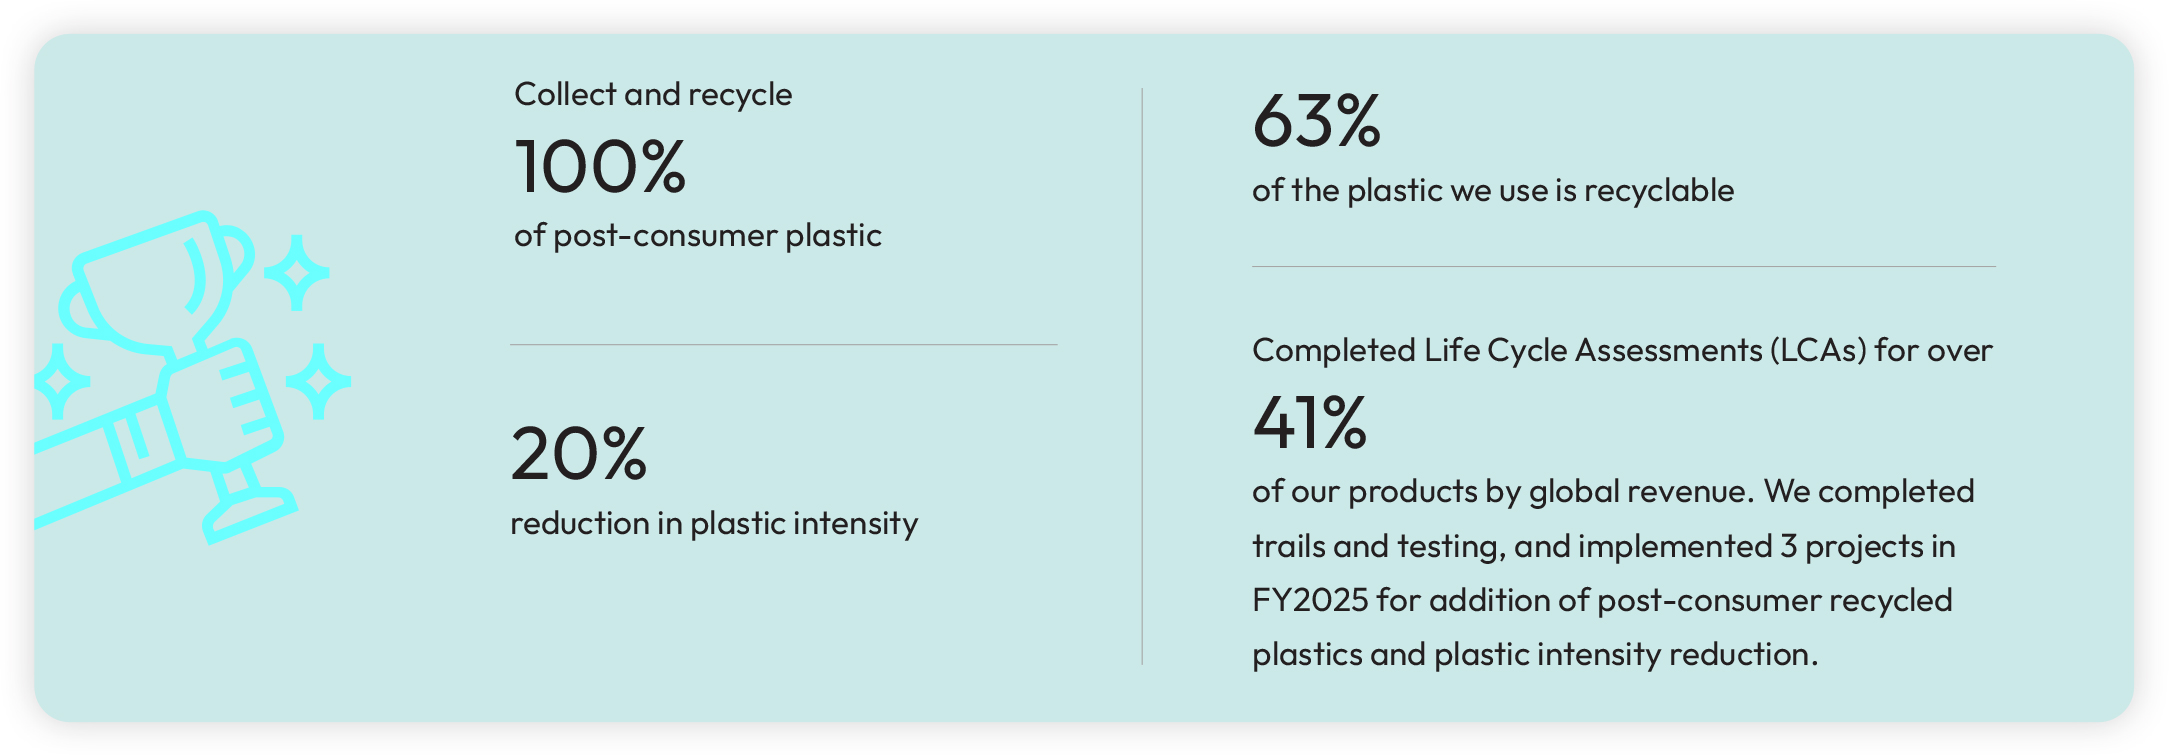
Our efforts to innovate for a greener planet are deeply embedded in our product development strategy. Through our ESG-first portfolio, we are focusing on reconstitution and natural ingredients across our core categories. By FY 2025-26, our goal is to conduct Life Cycle Assessments (LCAs) on 80% of our revenue-contributing products. These assessments will shape our efforts toward manufacturing environmentally responsible products and setting a sustainability benchmark for all new innovations. In line with this, we are scaling up our use of alternate packaging materials and increasing Post-Consumer Recycled (PCR) plastic content, thereby reducing reliance on virgin plastics. Our vision goes beyond regulatory compliance, encompassing product design, formulation, and delivery innovations to further reduce our plastic footprint.
As of FY 2024-25, we completed LCAs for 10 of our key products, which together contribute over 40% of our global revenue. We completed successful trials and integrated PCR plastic in the poly bags of Goodknight Coils and explored PCR PET options for Goodknight Xpress Liquid Vapouriser. These efforts underline our commitment to innovation and environmentally sound product development.
Twice a year, we host Green Manufacturing Conferences that bring together our environmental champions from manufacturing sites across the country. These forums are focused on knowledge sharing and peer learning around best practices in environmental sustainability. One day of this conference is reserved to increase awareness of waste management initiatives. We also feature expert-led sessions on advanced technologies and methods for waste reduction, recycling and even reuse.
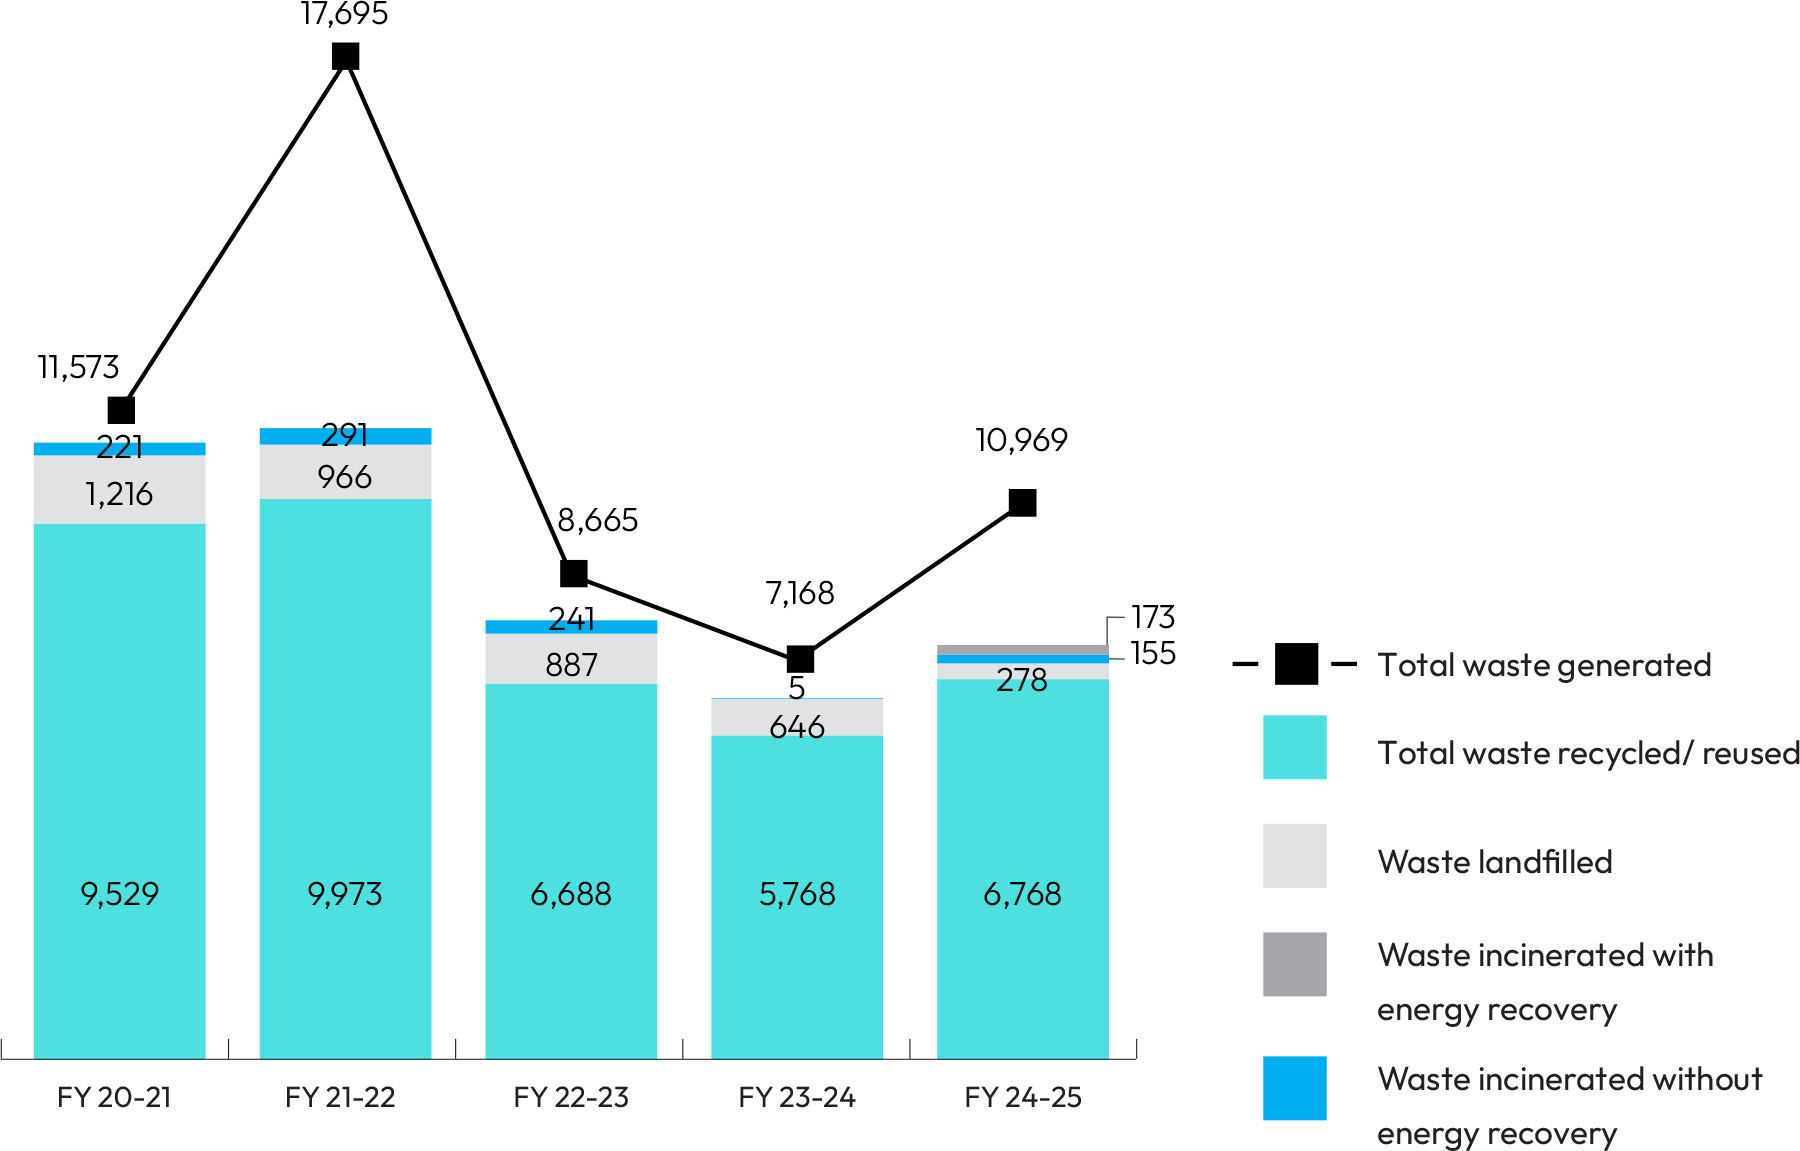
For FY 2024-25, our global non-hazardous waste generated was 9,773 MT and
hazardous waste was 1,196 MT.
Waste performance - Global (MT)
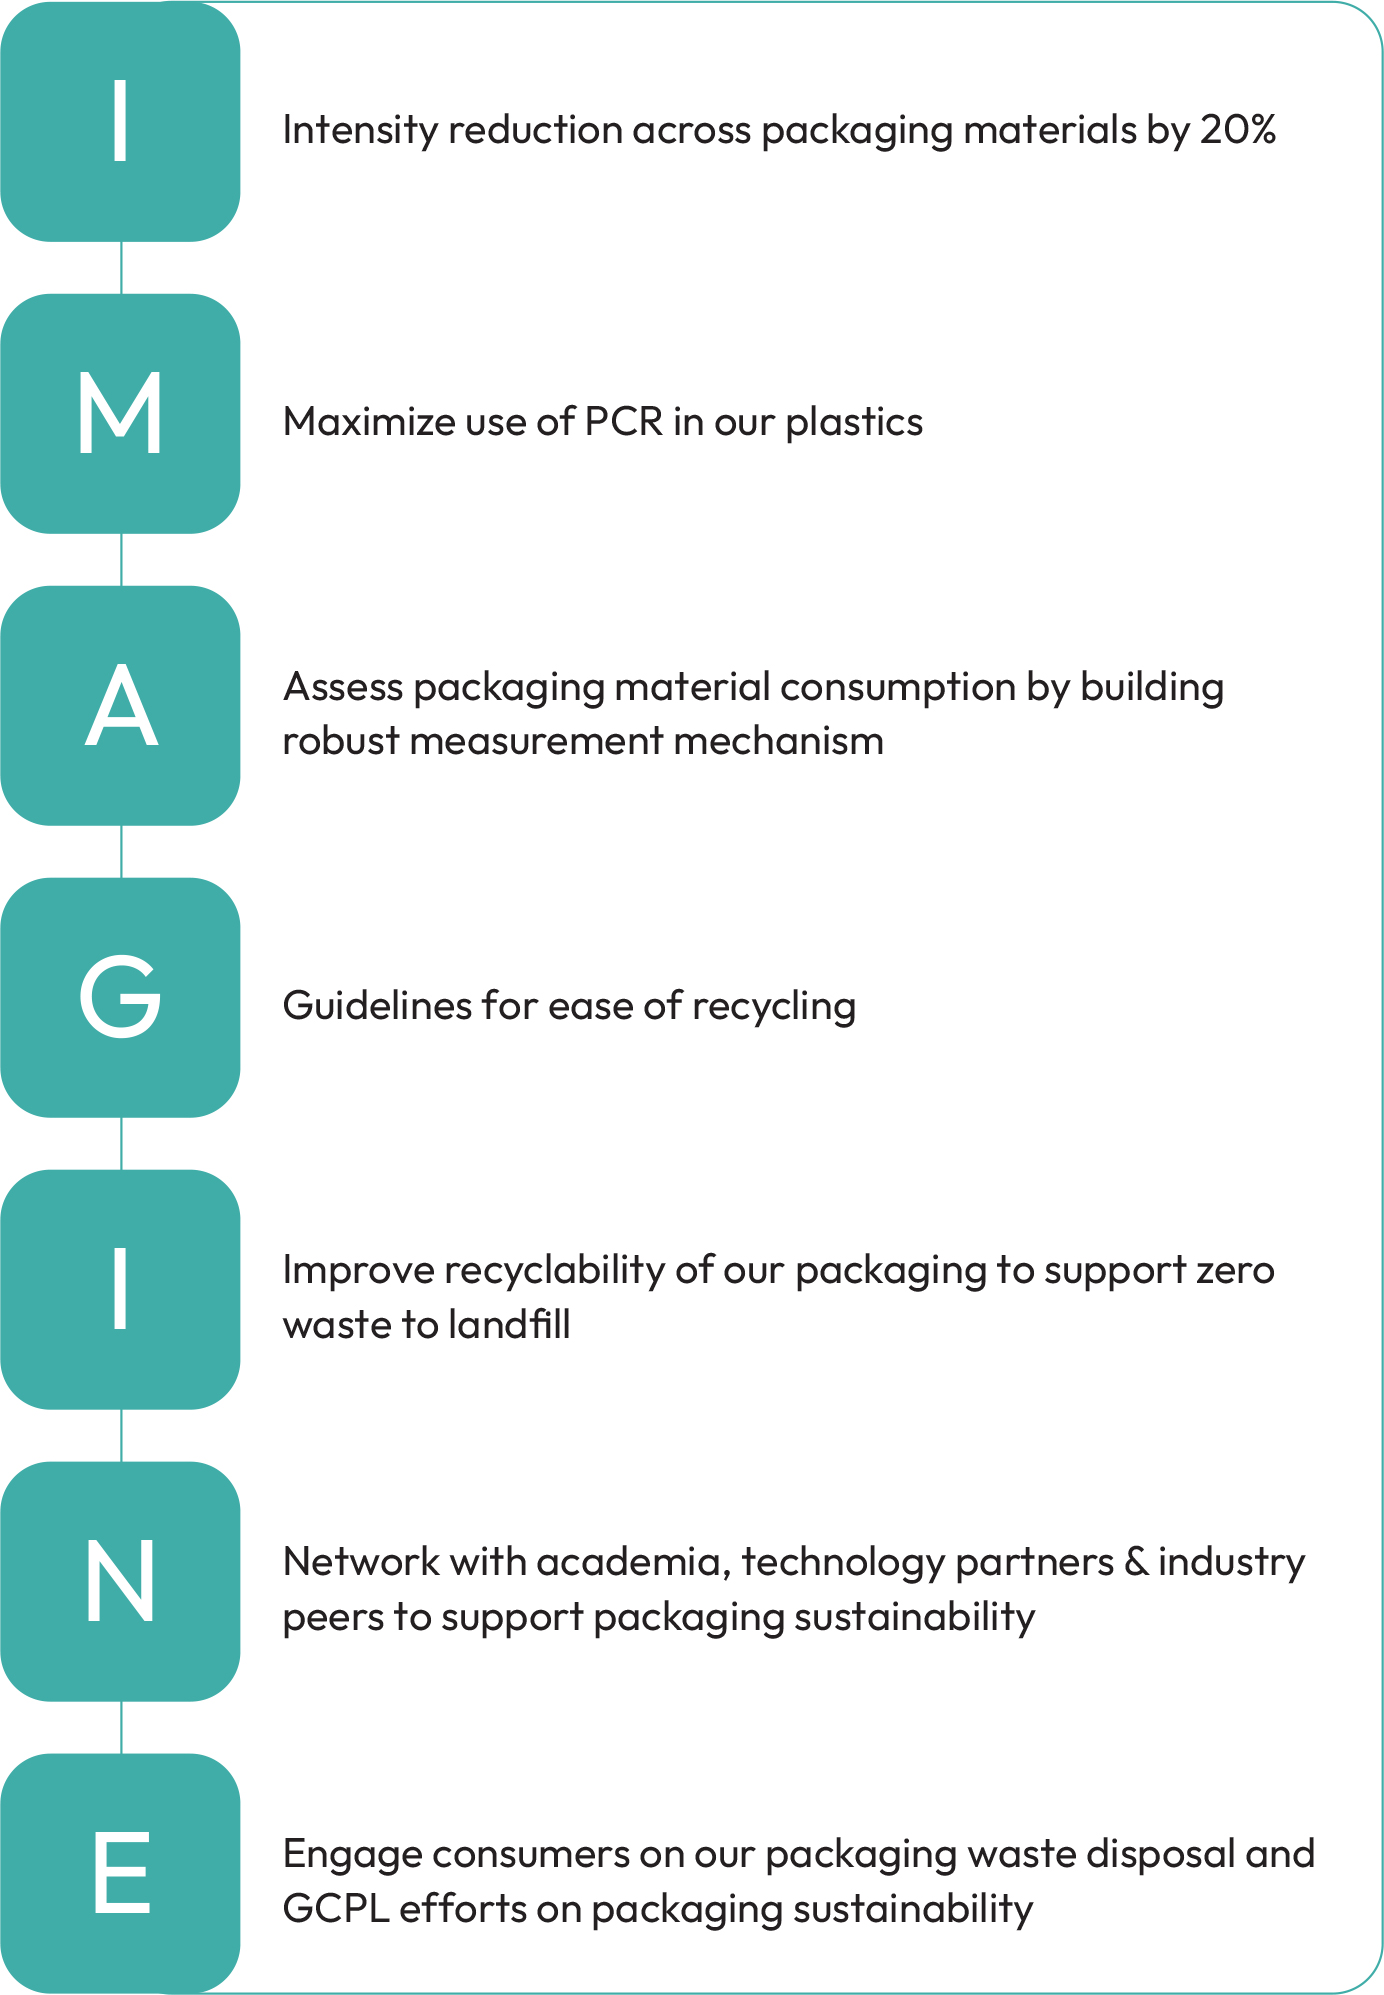
Sustainable packaging
As a consumer goods company, while our products are fully consumable, we recognize the critical role we play in minimizing the environmental impact of the plastic and packaging materials we use. To that end, we have established clear goals to reduce plastic use and increase the incorporation of post-consumer recycled (PCR) content in our packaging. Having already surpassed our initial targets on reducing plastic intensity, we are now accelerating efforts to increase PCR inclusion and explore alternatives to traditional plastics. Our roadmap for this transition is structured around a comprehensive 7-point agenda:
We continue to channel our R&D capabilities into making our packaging solutions more sustainable. Moreover, sustainability is integrated into leadership performance. The executive compensation of all GCPL leaders comprises of 15% of people and planet outcomes. These goals are aligned with our broader vision of creating an inclusive and greener future. Specific packaging-related targets tied to compensation include using better plastics, reducing total usage, and replacing virgin plastic with recycled alternatives.
Our sustainability packaging programmes focus on:
Expanding Recyclable Packaging – We aim to make 80% of our plastic packaging recyclable; as of now, we are at 63%. We have identified over 15 products for conversion to recyclable materials like aqueous coatings, paperboards, and BOPP.
- Promoting Reusable Packaging – Many of our supply chain materials, including cartons, bags, and corrugated boxes, are designed for repeated use. For example, the corrugated boxes we use are recycled and reused at least four times, reducing our operational footprint.
- Increasing Recycled Content – In India, we have piloted and scaling the inclusion of PCR in products like Magic Handwash, Goodknight Coil and Goodknight LV bottles, among others, targeting replacements of over 35% of virgin plastic with PCR. In Indonesia, we have rolled out innovative packaging solutions that has lowered our packaging intensity by 5.9% which is equal to reducing 1,045 tons of material use. Our products have also incorporated more than 1,280 tons of recycled can materials.
- Phasing Out Single-Use Plastics – We are systematically eliminating single-use plastics from our offices and manufacturing facilities. Our sites offices and offices have already achieved this, and now all our garbage bags, stationery, and office supplies are recyclable or biodegradable. We are also engaging with our suppliers to eliminate single-use raw material packaging in our operations.
- Reducing plastic packaging intensity – Using less plastic per tonne of product reduces the volume of plastic packaging we use meaning we increase our resource efficiency, lower the amount of plastic waste that’s generated, and reduce our Extended Producer Responsibility (EPR) obligations. We had targeted to reduce our plastic packaging intensity by 20% compared to FY 2019-20 and have already achieved our target. We implemented several initiatives to achieve this. One of the initiatives was our transition from metalized to non-metalized cartons for Goodknight Liquid Vapouriser refills. This initiative cut down our plastic consumption by 3,500 MT and delivered significant cost savings.
- R&D investments in sustainable packaging – In partnership with Confederation of Indian Industries (CII), we are working on exploring recyclable flexible plastics packaging solutions that will work in practice, without the loss of economic value of existing infrastructure, and with far lesser plastic waste and pollution. We are developing solutions and will run pilots for two projects - Surface printed monomaterial laminate for fabric wash stand up pouches, and
- R&D investments in sustainable packaging – In partnership with Confederation of Indian Industries (CII), we are working on exploring recyclable flexible plastics packaging solutions that will work in practice, without the loss of economic value of existing infrastructure, and with far lesser plastic waste and pollution. We are developing solutions and will run pilots for two projects - Surface printed monomaterial laminate for fabric wash stand up pouches, and Polyethylene based recyclable structure for Soap wrappers. The monomaterial project aims to create a recyclable, user-friendly packaging for fabric wash products that further makes the recycling process more efficient. The Polyethylene project will aim to create a soap wrapper that is not only recyclable but also can be made using recycled plastic. Both these solutions will be open source to promote better plastic circularity in the consumer goods industry at large.
Polyethylene based recyclable structure for Soap wrappers. The monomaterial project aims to create a recyclable, user-friendly packaging for fabric wash products that further makes the recycling process more efficient. The Polyethylene project will aim to create a soap wrapper that is not only recyclable but also can be made using recycled plastic. Both these solutions will be open source to promote better plastic circularity in the consumer goods industry at large.
Impact initiative
In Indonesia, we made strong progress in packaging sustainability by optimizing material use while ensuring product quality. In 2024, we successfully reduced the weight of our packaging containers from 13g to 11g across a production volume of over 10.4 million units, resulting in an annual reduction of 19,120 kg of polypropylene (PP). It’s a 15.4% cut in our plastic use. We remain committed to embedding sustainability across our value chain, while delivering both environmental impact and operational efficiency.
Packaging Materials - Wood/Paper fiber packaging
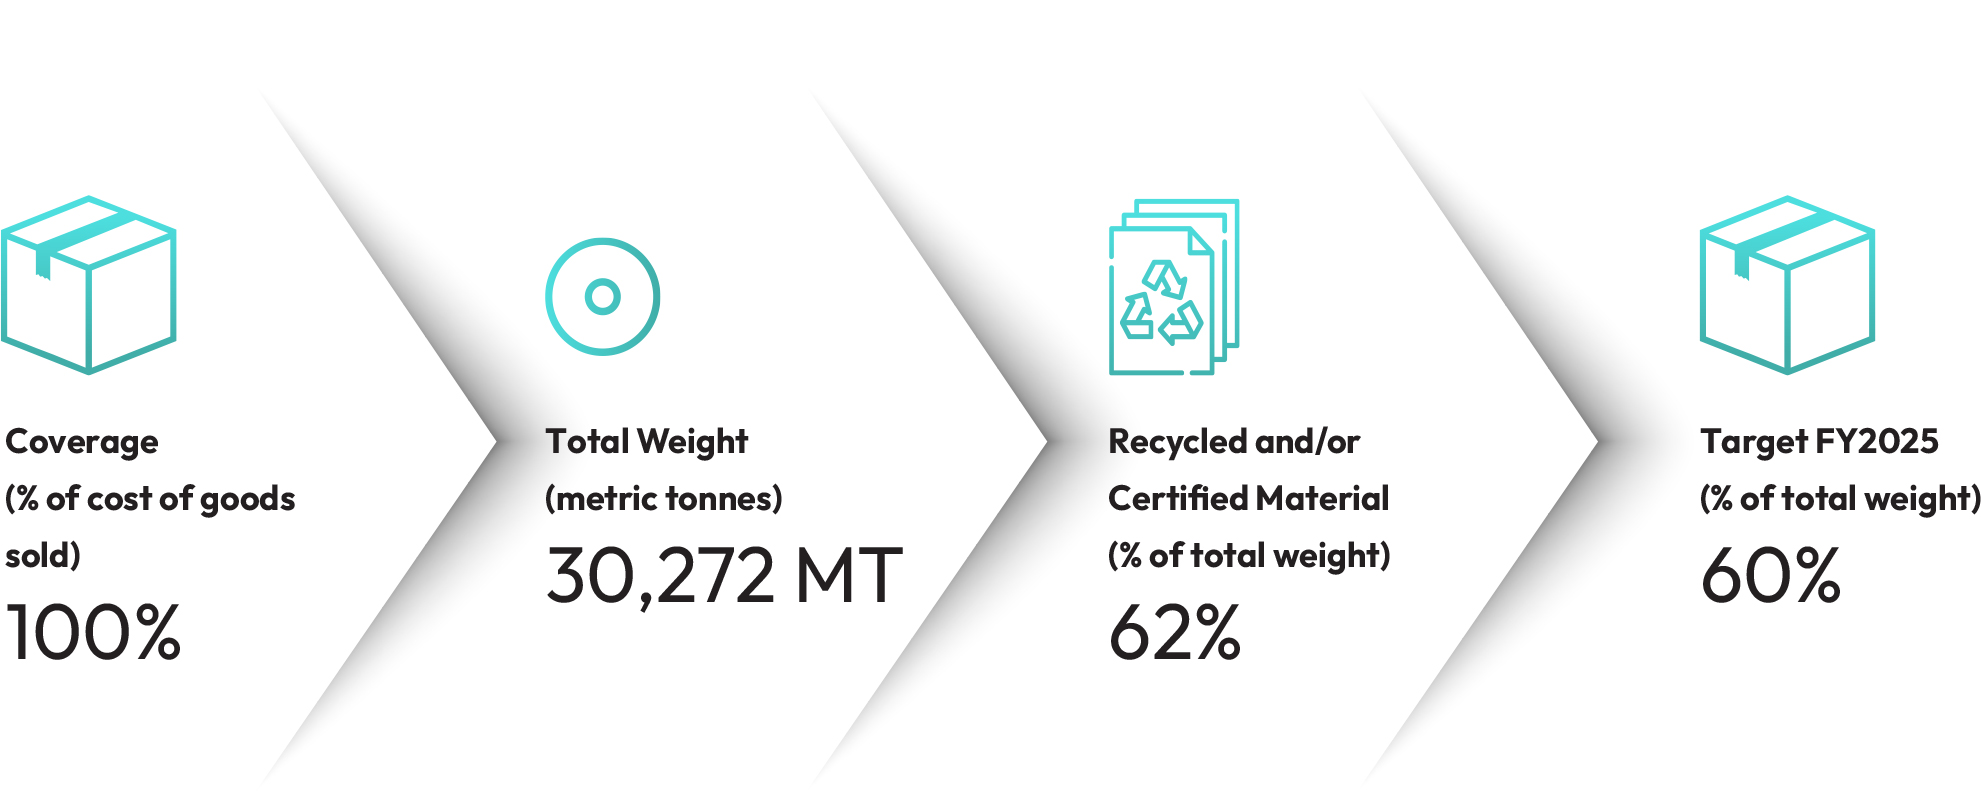
Plastic packaging
| FY 2021 | FY 2022 | FY 2023 | FY 2024 | What was your target for FY 2024? |
|
|---|---|---|---|---|---|
| A. Total weight (tonnes) of all plastic packaging |
19,500 | 18,750 | 17,995 | 17,948 | 18,000 |
| B. Percentage of recyclable plastic packaging (as a % of the total weight of all plastic packaging) |
30 | 34 | 40 | 63 | 60 |
| Coverage (as a % of cost of goods sold) | 100% | ||||
Post-consumer packaging waste and community solid waste and plastic
management
As a responsible global FMCG company, we are committed to reducing waste across our operations, products, and value chain. Since 2019, our Indian manufacturing units have maintained zero waste to landfill status. But our role doesn’t end at internal waste management. We’re actively supporting communities in addressing their local waste challenges.
We ensure 100% collection of the plastic waste we generate annually, in alignment with Indian EPR regulations. Additionally, we collaborate with local authorities, social enterprises, and community groups to drive recycling and material reuse.
- Puducherry: Since FY 2020-21, we’ve partnered with the Puducherry Municipal Corporation to implement a comprehensive community waste
- Puducherry: Since FY 2020-21, we’ve partnered with the Puducherry Municipal Corporation to implement a comprehensive community waste management programme. By enabling digital tracking, promoting source segregation, and running cleanup drives, we have diverted over 1,400 MT of waste. We've also established a sanitation park processing 4 TPD of waste and conducted medical camps for over 1,500 waste workers. The programme has influenced new tenders floated by the Government of Puducherry.
management programme. By enabling digital tracking, promoting source segregation, and running cleanup drives, we have diverted over 1,400 MT of waste. We've also established a sanitation park processing 4 TPD of waste and conducted medical camps for over 1,500 waste workers. The programme has influenced new tenders floated by the Government of Puducherry.
- Malanpur, Madhya Pradesh: Our three-year project with Malanpur Nagar Parishad spans all 15 wards. We aim for zero landfill waste and financial sustainability by year three. So far, over 2,300 MT of waste has been diverted.
- Palashbari, Assam: In partnership with the Palashbari Municipal Board, we implemented a decentralized solid waste management system covering all 10 wards and nearby commercial zones. To date, we've diverted over 2,900 MT of waste from landfills.
- Kasauli, Himachal Pradesh: Recognizing the threat of mounting waste to local ecology, we launched a municipal waste
- Kasauli, Himachal Pradesh: Recognizing the threat of mounting waste to local ecology, we launched a municipal waste management programme in the Kasauli cantonment area and five Panchayats. Activities included a baseline survey, clean-up drives, waste-themed art installations, and school engagement initiatives. In FY 2024-25, we diverted 16 MT of waste.
management programme in the Kasauli cantonment area and five Panchayats. Activities included a baseline survey, clean-up drives, waste-themed art installations, and school engagement initiatives. In FY 2024-25, we diverted 16 MT of waste.
- Goa: In collaboration with the Goa State Pollution Control Board and Goa Waste Management Corporation, we launched a three-year project with Bicholim and Sattari Municipal Councils,
- Goa: In collaboration with the Goa State Pollution Control Board and Goa Waste Management Corporation, we launched a three-year project with Bicholim and Sattari Municipal Councils, implemented by the Mineral Foundation of Goa and Sampurn(E)arth. We diverted over 2000 MT of waste from landfills in FY 2024-25 from landfills.
implemented by the Mineral Foundation of Goa and Sampurn(E)arth. We diverted over 2000 MT of waste from landfills in FY 2024-25 from landfills.
- Indonesia: We have set up two waste banks that upskill women to recycle and upcycle waste. Through them and our partnership with Indonesia Packaging Recovery Organization, we have recycled 472 tons of post-consumer waste.
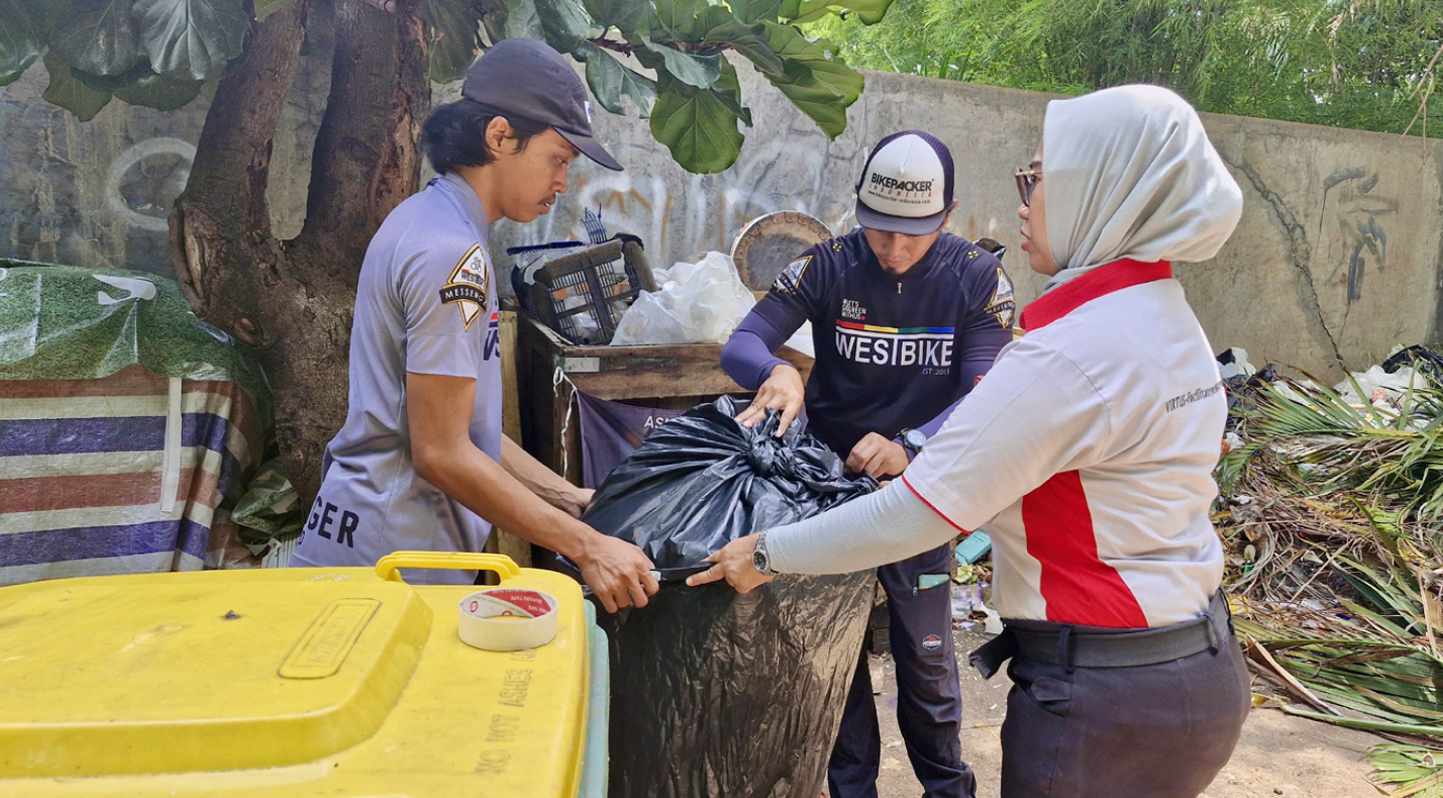
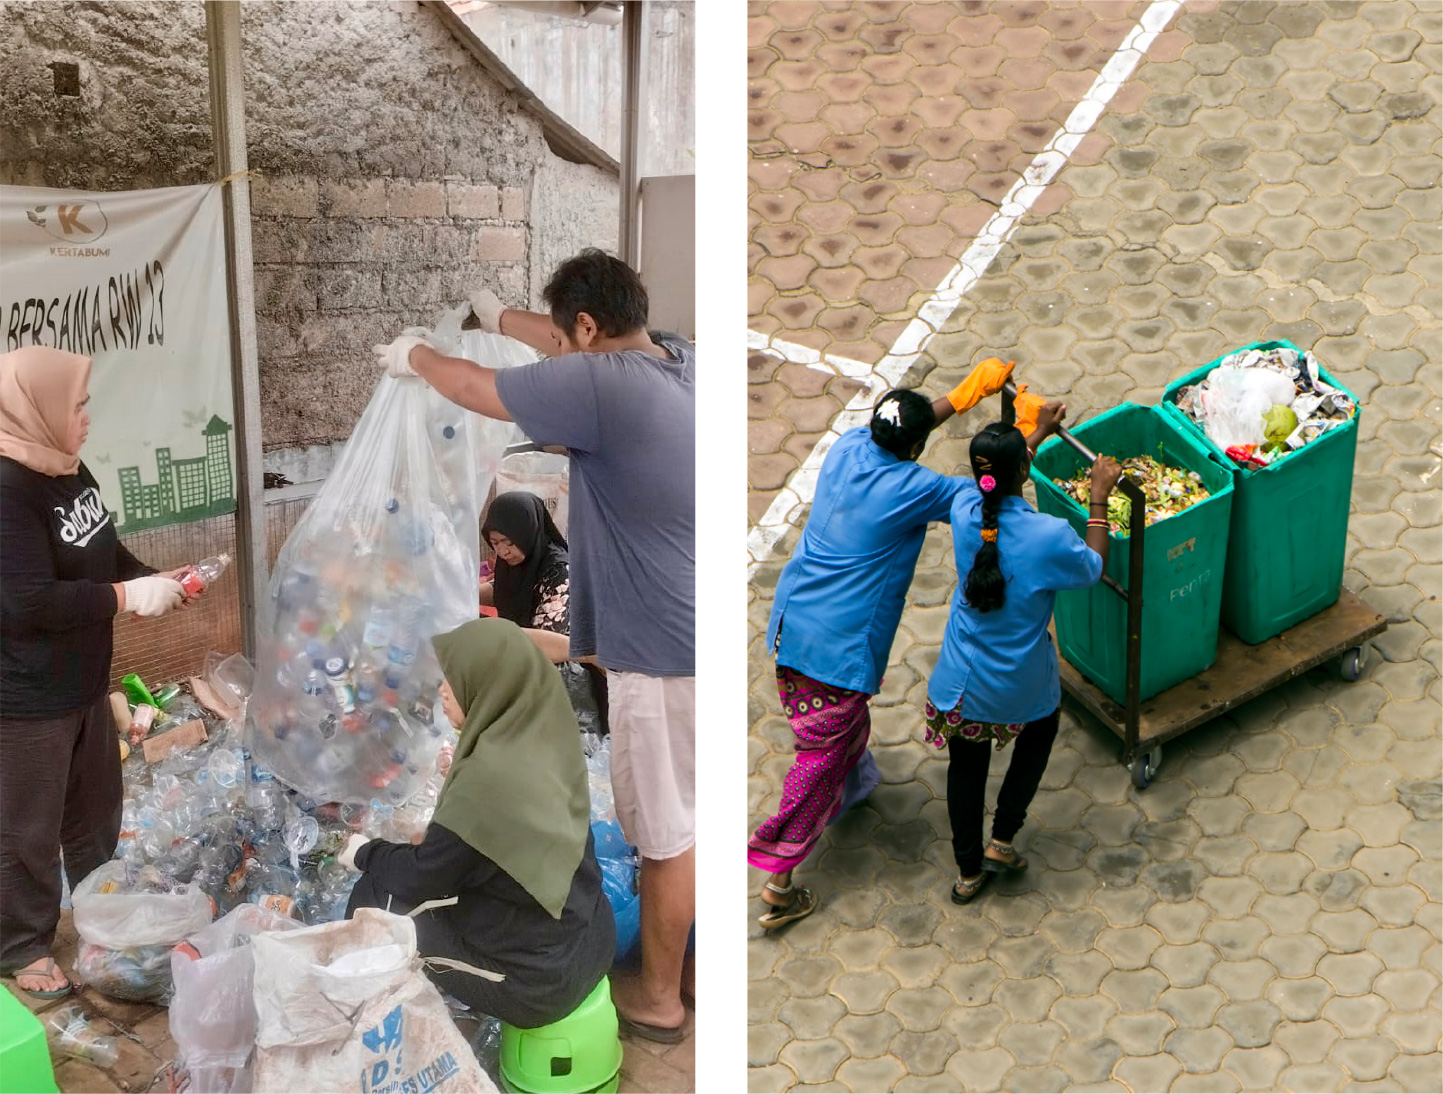
Community waste collection and
recycling initiatives
Through our community efforts, we ensured that recyclable packaging is actually recycled through scientific waste management systems and collaboration with municipalities and urban local bodies. Since 2019, our community-centric waste management programs have successfully diverted over 15,000 MT of waste from landfills. We have far exceeded our goal to transform waste management systems in five municipalities and divert over 8,000 MT of waste from landfills by FY 2025-26 through collaborative partnerships.
Community solid waste and plastic
management program
Enhanced, digitally
enabled consumer insight
Remaining true to our consumer-centricity philosophy, we continue to focus our innovation efforts through stronger, digitally enabled consumer insight capabilities. These enhancements empower our teams to design hyper-relevant products and experiences that closely align with consumer preferences and behavioural trends.
Key components of this strategic pillar include:


1. Global Structure
Our global category teams are designed to promote cross-pollination of insights and expertise across geographies. This collaborative structure sharpens our strategic decision-making and ensures we leverage learnings at scale.
2. Standardised testing protocols
Clear global protocols and action standards allow for consistent, robust evaluation of innovations. This harmonisation not only mitigates risk but also boosts our speed and success in bringing high-impact products to market.

3. Strong agency partnerships
Deepening collaborations with strategic agency partners enhances our access to advanced methodologies and global insight networks. This significantly enriches our capability to craft products tailored to culturally diverse and evolving consumer needs.

4. Digital techniques
We leverage cutting-edge digital tools to gather real-time consumer data, detect emerging preferences, and spot whitespace opportunities. This digital edge equips us with agility, responsiveness, and a forward-looking innovation mindset.
Investments in R&D, design,
technology, and skills
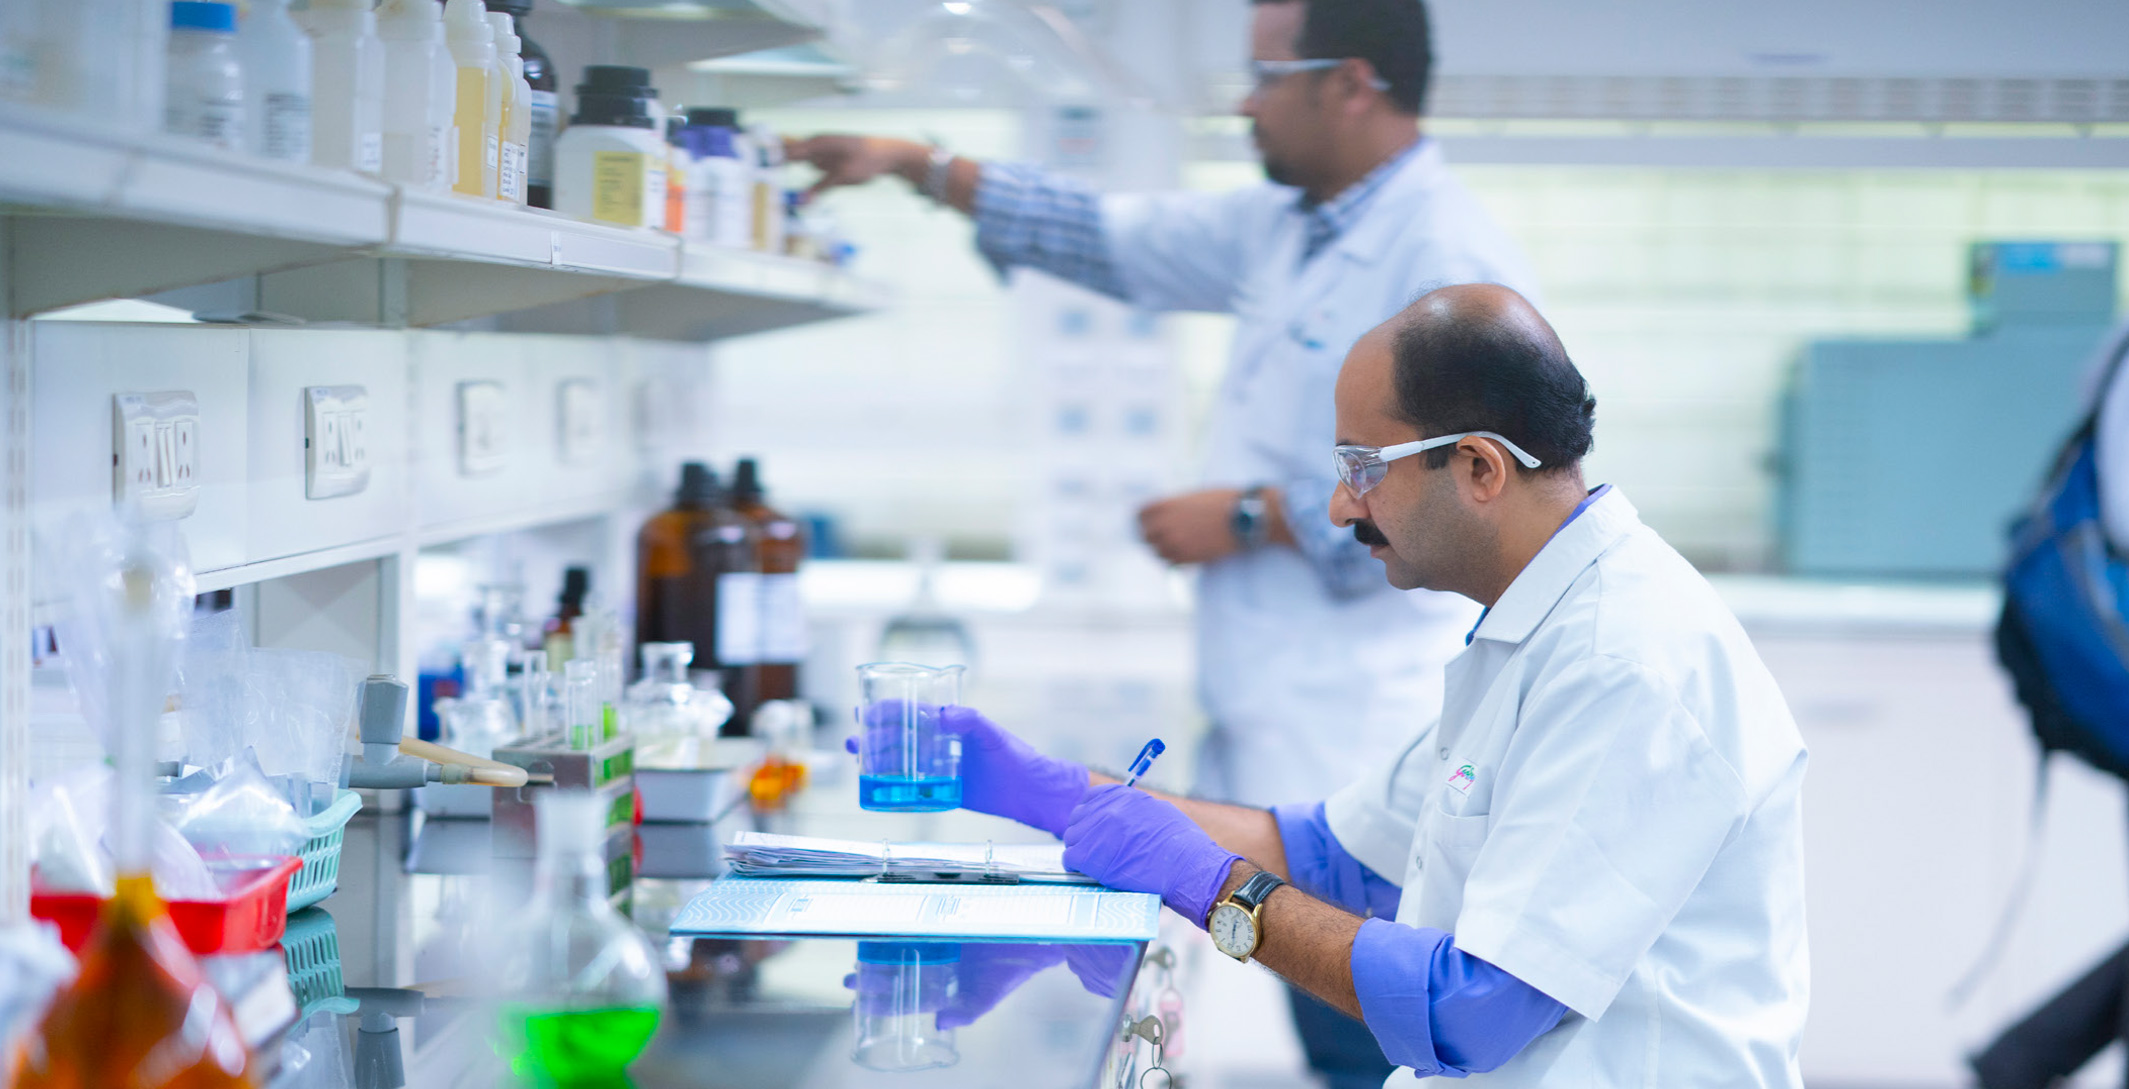
Our state-of-the-art R&D centre at our global headquarters, Godrej One in Mumbai, serves as the epicentre of our innovation ecosystem. This facility, in synergy with our local R&D teams, nurtures collaboration across geographies and enables seamless knowledge sharing and cross-market application of insights.
Our in-house Design - Innovation - Strategy - Creative Collaboration studio & community, fondly known as DISCO, is a team of creatives, designers, innovators, strategists, visualisers, thinkers, and makers, shaping how our innovations show up in the world. Our team crafts brands, identity systems, delightful packaging, meaningful products and empathy drive engagements that
Our in-house Design - Innovation - Strategy - Creative Collaboration studio & community, fondly known as DISCO, is a team of creatives, designers, innovators, strategists, visualisers, thinkers, and makers, shaping how our innovations show up in the world. Our team crafts brands, identity systems, delightful packaging, meaningful products and empathy drive engagements that are functional, beautiful, environment-friendly, and future-forward. Unlike many peers in the FMCG sector who outsource design, we have cultivated this capability internally turning it into a key competitive differentiator.
are functional, beautiful, environment-friendly, and future-forward. Unlike many peers in the FMCG sector who outsource design, we have cultivated this capability internally turning it into a key competitive differentiator.
Our state-of-the-art global R&D centre at
our headquarters, Godrej One in Mumbai is
where we lead new product development.
Sustainability built into our
products from Day One
Sustainability is an intrinsic part of our product development philosophy. We evaluate every new product’s life cycle impact, using robust qualitative and quantitative research. From focus groups and consumer panels to analytics, to refine and fortify our New Product Development
Sustainability is an intrinsic part of our product development philosophy. We evaluate every new product’s life cycle impact, using robust qualitative and quantitative research. From focus groups and consumer panels to analytics, to refine and fortify our New Product Development (NPD) framework. Our R&D function remains at the core of crafting superior products that benefit both people and the planet.
(NPD) framework. Our R&D function remains at the core of crafting superior products that benefit both people and the planet.
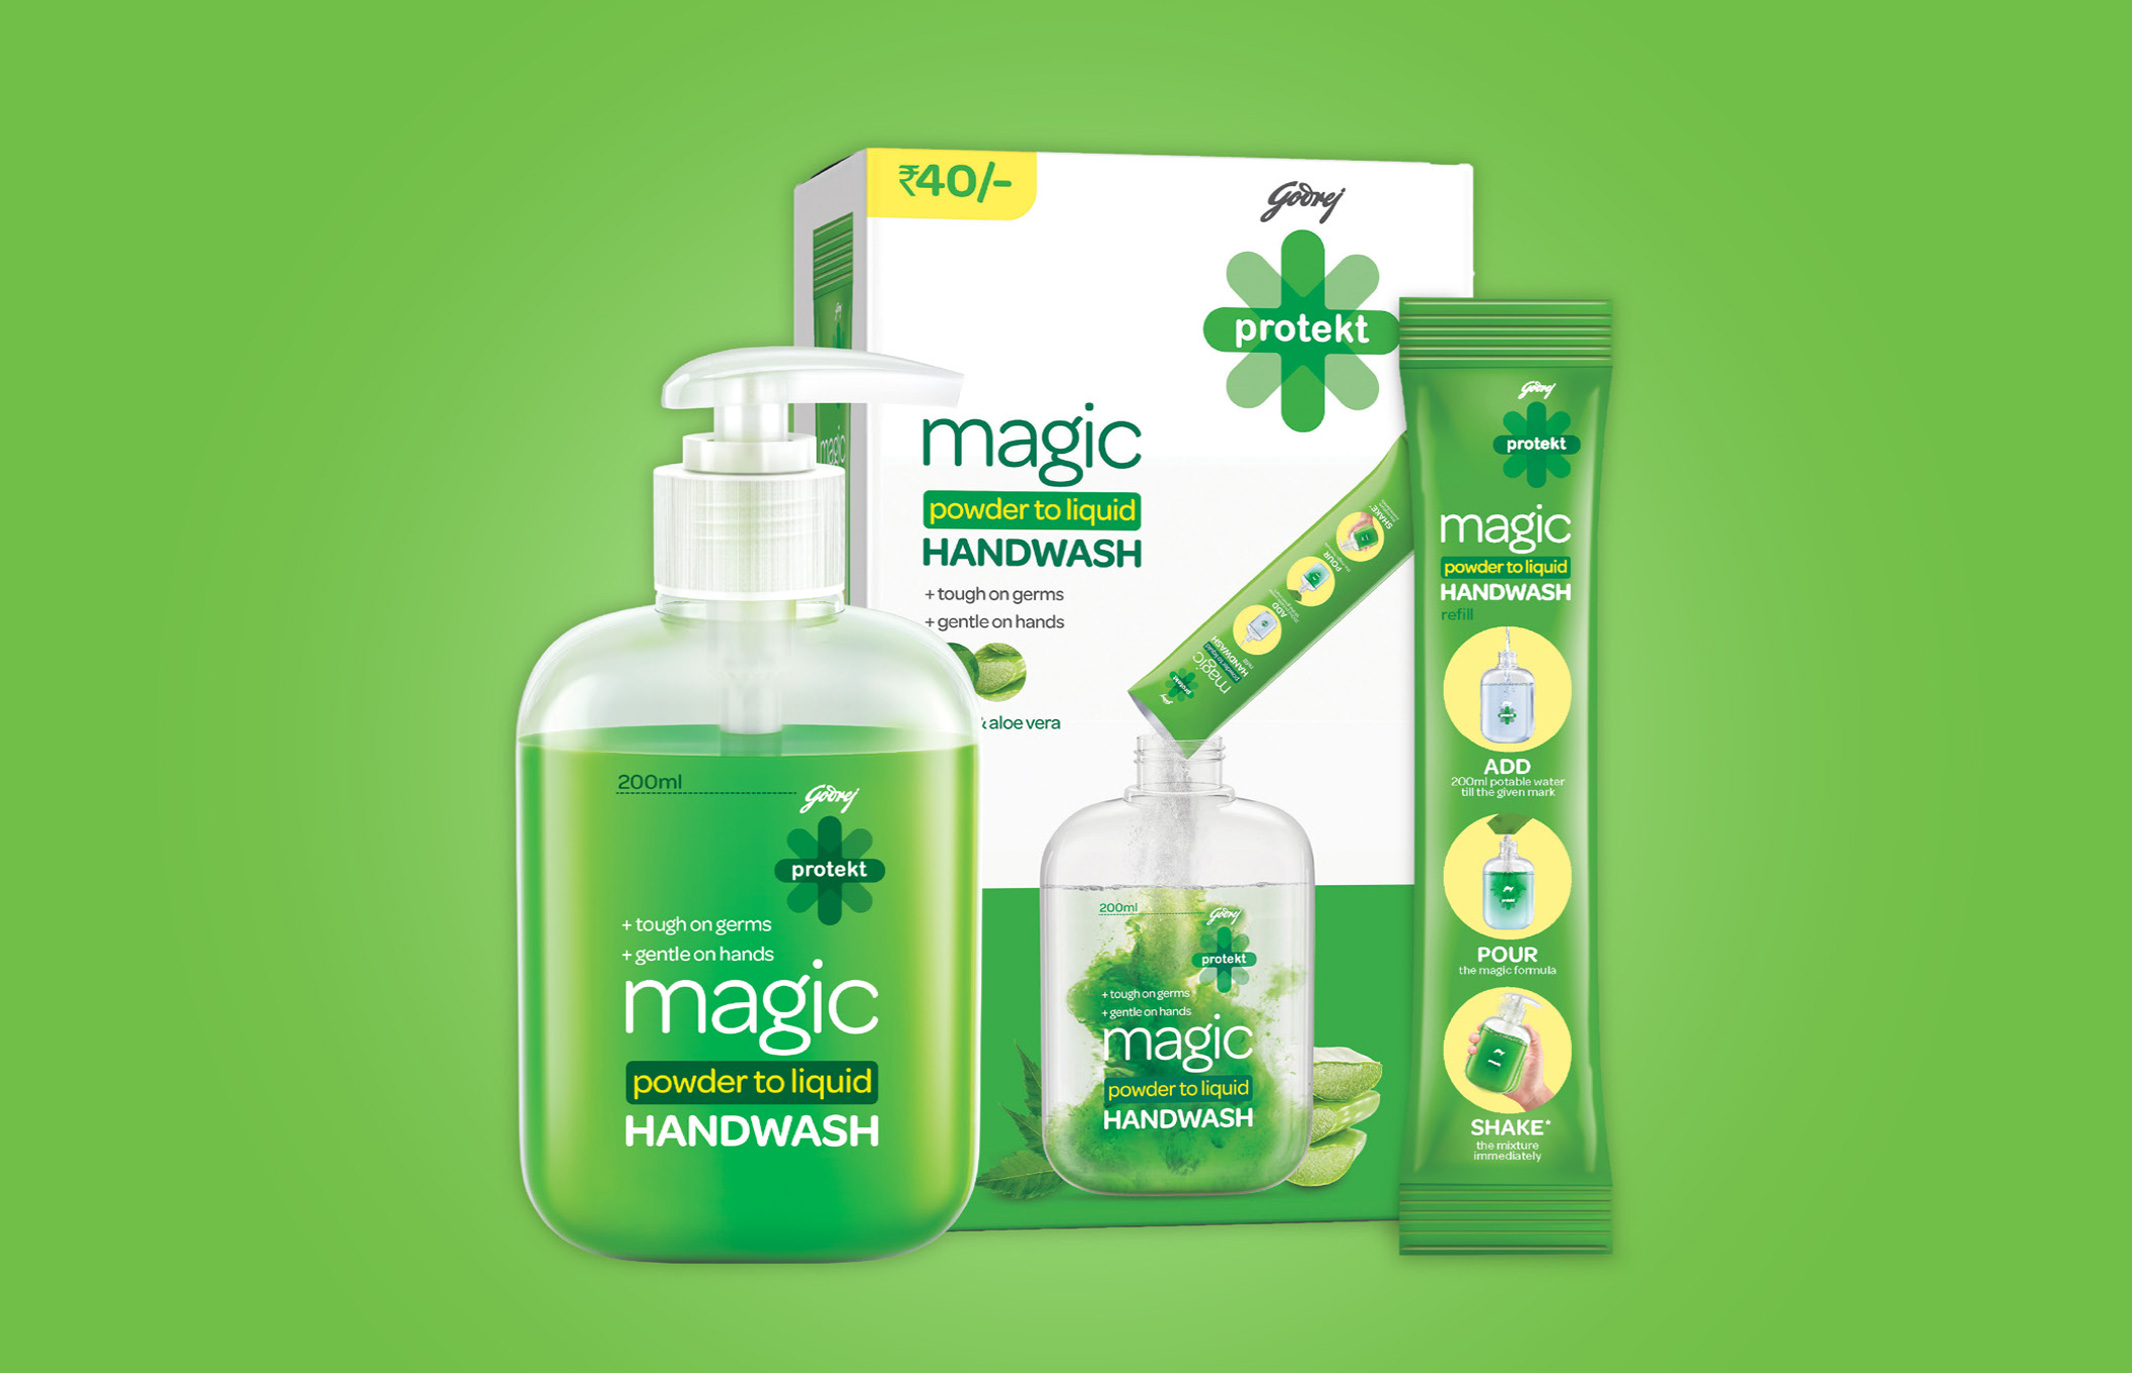
1. Our Reconstitution Portfolio
Central to our sustainability efforts is our reconstitution portfolio—a disruptive approach to product formulation that reduces environmental impact while delivering value to consumers. Acknowledging the high water content in most personal care products, we’ve reimagined formats to eliminate unnecessary weight and resource consumption.
Magic Handwash and Magic Bodywash exemplify this innovation. These powder-to-liquid or concentrate-based formats allow consumers to add water themselves, thereby
Magic Handwash and Magic Bodywash exemplify this innovation. These powder-to-liquid or concentrate-based formats allow consumers to add water themselves, thereby reducing the carbon footprint of traditional liquid products. By significantly lightening the product weight and volume, these formats reduce reliance on packaging materials, leading to 84% less plastic use and cut down fuel consumption during transportation by 44%, directly translating into reduced greenhouse gas emissions.
reducing the carbon footprint of traditional liquid products. By significantly lightening the product weight and volume, these formats reduce reliance on packaging materials, leading to 84% less plastic use and cut down fuel consumption during transportation by 44%, directly translating into reduced greenhouse gas emissions.
Importantly, we challenge the notion that sustainability comes at a premium. Our reconstituted products are affordably priced, reinforcing our belief in making sustainable choices inclusive. We advocate
Importantly, we challenge the notion that sustainability comes at a premium. Our reconstituted products are affordably priced, reinforcing our belief in making sustainable choices inclusive. We advocate for a “green discount” rather than a green premium, ensuring that more consumers can embrace eco-conscious living without financial trade-offs. By doing so, we aim to democratize sustainability, encourage wider adoption, and catalyze a shift in consumer behavior toward more responsible, planet-friendly consumption.
for a “green discount” rather than a green premium, ensuring that more consumers can embrace eco-conscious living without financial trade-offs. By doing so, we aim to democratize sustainability, encourage wider adoption, and catalyze a shift in consumer behavior toward more responsible, planet-friendly consumption.
With Magic powder-to-liquid handwash, our sustainable and affordable
solution to handwashing, we are driving change in consumer behaviour and
fostering a greener, more responsible market.
Supply Chain Sustainability
Aligned with our Good & Green goals, we have established clear sustainability criteria for our suppliers, outlined in the GCPL Policy for Responsible Supply. We hold all our key suppliers accountable for adhering to these standards and are dedicated to supporting them. Both existing and prospective suppliers are required to meet the outlined expectations delineated in the Policy.
Our commitment extends to assisting our suppliers in enhancing the sustainability of their operations, with a particular focus on four key parameters:

Ethically driven
- Business integrity
and ethics - Human
rights
- Accountability and responsibility
- Legal and regulatory compliance

Social focused
- Responsible conduct with stakeholders
- Employee health and safety
- Local community development

Green inspired
- Green products and processes
- Reduce, reuse, and recycle
- Adopting green initiatives and practices

Quality Centred
- Quality management systems
- Facility and machinery
- GMP and quality
controls - Material
management
As part of our evaluation framework, we gather comprehensive qualitative and quantitative insights to develop a composite sustainability score for each supplier, based on their responses. To ensure ongoing compliance and continuous improvement, we mandate self-declarations from suppliers and conduct external audits through a reputed third-party consultant. Furthermore, we define category-specific targets, share relevant industry benchmarks, and provide actionable recommendations and improvement roadmaps.
Our commitment to transparency and governance is reinforced through regular updates to the Board ESG Committee on supplier performance and progress. This ensures alignment with our refreshed Policy for Responsible Supply.
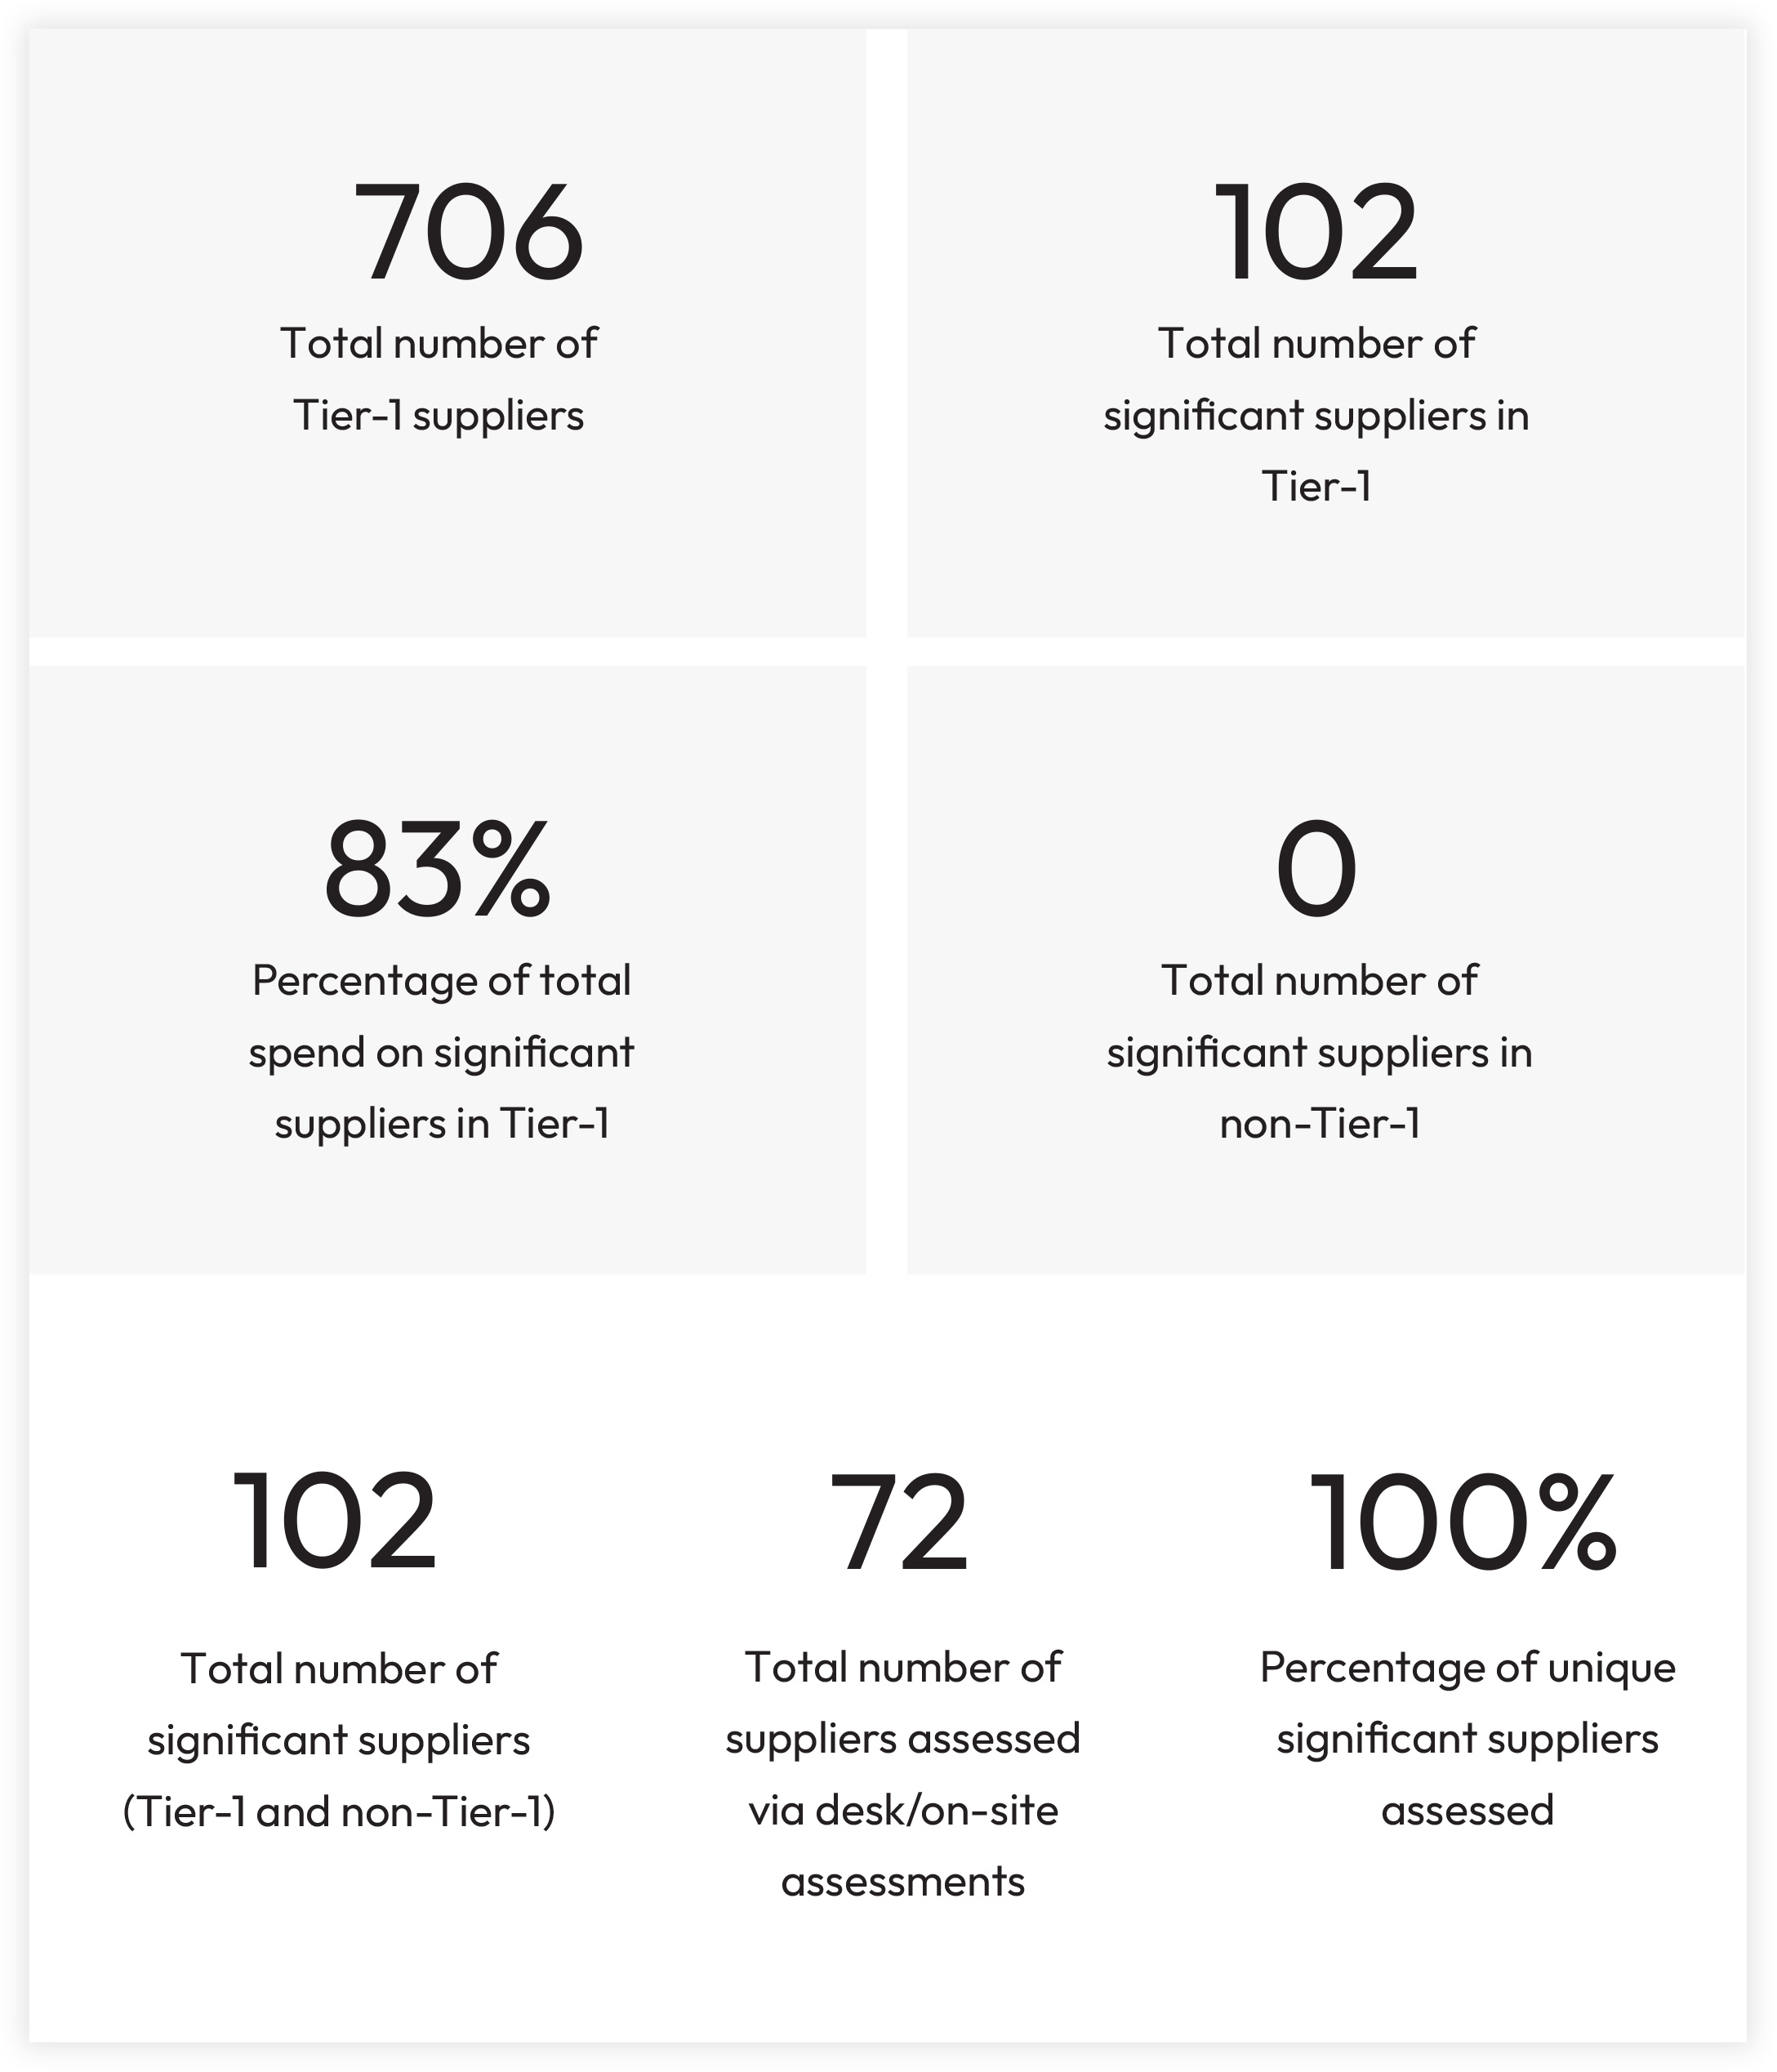
In FY 2024-25, we renewed our Supplier ESG engagement and assessment program in line with SEBI’s Business Responsibility and Sustainability Reporting (BRSR) framework for value chain disclosures, CDP, and globally recognised standards such as ISO 9001, ISO 28000, ISO 45001, SEDEX, and EcoVadis. We deepened our engagement with focussed trainings and strengthened our assessment to help us better gauge and mitigate potential ESG risks across our value chain.
In FY 2024-25, we assessed 72 of our top suppliers, covering over 70% of our total procurement spend. Of these, 9 suppliers underwent on-site audits conducted by an external third-party independent auditor. ESG risk profiling was integrated into the process, considering country, sector, and commodity-specific risks, particularly for chemicals, corrugated packaging, dyes and pigments, ceramic parts, aluminium tins, and electrical components.
Among the 72 suppliers with historical data, no suppliers were found to be non-compliant or responsible for any material negative impact. Consequently, no supplier corrective plans on any non-compliance were communicated and no supplier relationships were terminated.
As we revised and detailed our assessment, we found a majority of our suppliers lacked some understanding of ESG data reporting and disclosures. To improve on this, we undertook capacity building for data reporting for both suppliers and our internal teams. We also provided training in other ESG topics including GHG emissions, water and waste management, biodiversity management and zero deforestation, and sustainable packaging solutions, among others. We also facilitated sharing of industry best practices and encouraged practical, scalable improvement actions. In FY 2024-25, 54 unique suppliers, accounting for about 60% of our critical Tier-1 supplier base participated in these training programs.
We have also embedded sustainability assessments into our vendor onboarding process, making it a prerequisite for new suppliers through a structured self-declaration mechanism. Our procurement practices are reviewed annually to ensure alignment with our policy goals, and we continually monitor supplier progress toward the low-risk zone.
Third-party ESG on-site assessment
of our suppliers in FY2025
Supplier screening for fiscal year 2024-25